PuriActives® GPIGlycerophosphoinositol Choline
Scientific and Technical Profile
PuriActives® GPI
Sunflower-derived soothing technology
For skin and scalp comfort
Glycerophosphoinositol Choline
PuriPharm Co. Ltd.
Product overview · Positioning
An active ingredient for soothing care
Glycerophosphoinositol Choline
GLYCEROPHOSPHOINOSITOL CHOLINE
Source: sunflower phospholipids
Process: enzymatic bioconversion
A scientific basis for sensitive-skin formulations and soothing scalp care.
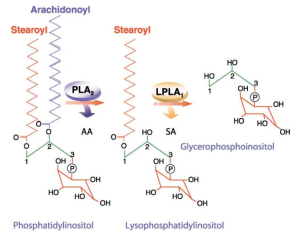
Original labels: phosphatidylinositol; lysophosphatidylinositol; glycerophosphoinositol; arachidonoyl; stearoyl; PLA₂ and LPLA₁ enzyme labels.
Original Figure 1: schematic of glycerophosphoinositol formation through phosphatidylinositol metabolism.
Corda D et al. Biochim Biophys Acta. 2002;1582:52–69. DOI: 10.1016/S1388-1981(02)00137-3.
Product overview · Chemical identity
The choline salt of glycerophosphoinositol
A defined chemical identity supports ingredient identification, literature searches and active-content calculations.
| Item | Molecular information |
| INCI | GLYCEROPHOSPHOINOSITOL CHOLINE |
| CAS | 425642-32-6 |
| Molecular formula | C₁₄H₃₂NO₁₂P |
| Molecular weight | 437.38 g/mol |
This information describes the compound itself. Active content and supply form of the commercial ingredient depend on the applicable product specifications.
PubChem. Glycerophosphoinositol choline. CID 91936944. https://pubchem.ncbi.nlm.nih.gov/compound/91936944
Product overview · Source and process
Enzymatic bioconversion of sunflower phospholipids
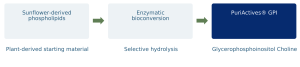
Produced by enzymatic bioconversion using sunflower-derived phospholipids as the starting material.
Evidence guide
Research supporting skin and scalp comfort
Understand GPI through its mechanisms, then connect cell, animal and human studies to formulation applications.
| Research level | Molecular mechanisms |
| Core question | How are inflammatory signals regulated? |
| Main assessments | MAPK, IKK / NF-κB, gene expression |
| Research level | Cells and epidermis |
| Core question | Can irritation-related responses be reduced? |
| Main assessments | Degranulation, cytokines, PGE₂, IL-1α |
| Research level | Animal studies |
| Core question | Are responses observed in vivo? |
| Main assessments | TNF-α, Mac-1 and skin studies of related salts |
| Research level | Human studies and applications |
| Core question | Which care settings have been observed? |
| Main assessments | Erythema, lesions, pruritus, scalp comfort |
Ingredient form, model and formulation conditions are specified in the relevant sections.
Mechanisms · Endogenous GroPIns research
GPI participates in cellular lipid-signaling regulation
Sequential deacylation of phosphatidylinositol produces glycerophosphoinositol.
Research on the free metabolite GroPIns provides a mechanistic basis for understanding GPI. This product uses its choline salt form.
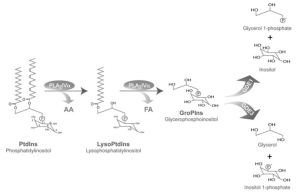
Original Figure 1, excerpted from a metabolic schematic. GroPIns = glycerophosphoinositol.
Corda D et al. Biochem Soc Trans. 2012;40:101–107. DOI: 10.1042/BST20110679.
Mechanisms · Endogenous GroPIns research
Inflammatory stimulation increases endogenous GroPIns
LPS stimulation increases intracellular GroPIns in human monocytes.
The study supports a role for this endogenous metabolite in cellular responses to inflammatory stimulation.
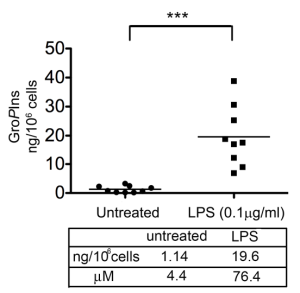
Figure labels: untreated; LPS; ng/10⁶ cells; μM. The inset data table is transcribed below.
Inset table: GroPIns levels
| Unit | Untreated | LPS |
| ng/10⁶ cells | 1.14 | 19.6 |
| μM | 4.4 | 76.4 |
Original Figure 7. Human monocytes from 9 donors; LPS 0.1 μg/mL for 45 minutes; LC–MS/MS measurement.
Vessichelli M et al. J Biol Chem. 2017;292:12828–12841. DOI: 10.1074/jbc.M116.773861. PMID: 28600357.
Mechanisms · Endogenous GroPIns research
Modulation of MAP kinase signaling
Western blots show that GroPIns reduces LPS-induced ERK, JNK and p38 phosphorylation.
These early signaling changes connect external stimulation to downstream regulation of inflammatory genes.
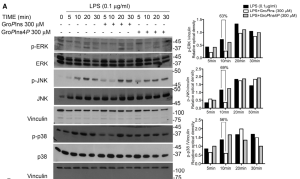
Original labels: time (min); p- denotes phosphorylated protein; vinculin; GroPIns and the separate GroPIns4P comparator.
Original Figure 3A. Human monocytes; GroPIns 300 μM; representative blots and densitometry. GroPIns4P is a separate comparator substance.
Vessichelli M et al. J Biol Chem. 2017;292:12828–12841. DOI: 10.1074/jbc.M116.773861. PMID: 28600357.
Mechanisms · Endogenous GroPIns research
Effects on the IKK / IκB signaling axis
GroPIns reduces phosphorylation of the IKK complex and alters the time course of IκBα degradation.
This provides a molecular basis for reduced NF-κB activation.
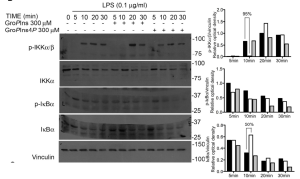
Original labels: time (min); p-IKKα/β and p-IκBα phosphorylation readouts; vinculin.
Original Figure 3B. Pretreatment with GroPIns 300 μM for 20 minutes, followed by LPS 0.1 μg/mL; observation at 5–30 minutes.
Vessichelli M et al. J Biol Chem. 2017;292:12828–12841. DOI: 10.1074/jbc.M116.773861. PMID: 28600357.
Mechanisms · Endogenous GroPIns research
Microscopy reveals NF-κB localization
Original micrographs show changes in cellular p50 and p65 localization after inflammatory stimulation.
GroPIns reduces LPS-induced nuclear translocation of NF-κB.
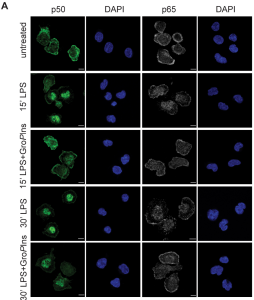
Original Figure 4A. p50: green; p65: gray; DAPI: blue. GroPIns 300 μM. Original scale bars retained.
Vessichelli M et al. J Biol Chem. 2017;292:12828–12841. DOI: 10.1074/jbc.M116.773861. PMID: 28600357.
Mechanisms · Endogenous GroPIns research
Reduced nuclear translocation of NF-κB
The authors report approximately 50% and 45% reductions in p50 and p65 nuclear translocation, respectively, at 30 minutes with GroPIns.
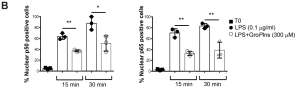
Figure labels: nuclear p50/p65-positive cells (%); T0; time in min.
Original Figure 4B. LPS 0.1 μg/mL, with or without GroPIns 300 μM; 100 randomly selected cells counted per sample.
Vessichelli M et al. J Biol Chem. 2017;292:12828–12841. DOI: 10.1074/jbc.M116.773861. PMID: 28600357.
Mechanisms · Endogenous GroPIns research
Original EMSA images show reduced NF-κB–DNA binding
GroPIns reduces the LPS-induced NF-κB DNA-binding signal. The original electrophoretic images complement the nuclear-translocation microscopy evidence.
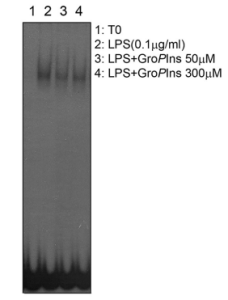
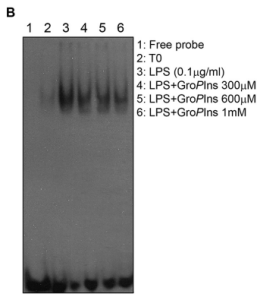
Original Figure 5A–B. Left: cell pretreatment at 50 or 300 μM. Right: nuclear-extract competition experiment at 300–1000 μM. These are different experimental conditions.
Vessichelli M et al. J Biol Chem. 2017;292:12828–12841. DOI: 10.1074/jbc.M116.773861. PMID: 28600357.
Mechanisms · Endogenous GroPIns research
Reduced NF-κB recruitment to target-gene promoters
Chromatin immunoprecipitation provides further promoter-level evidence.
Reduced p65 recruitment to the TNF-α promoter is consistent with lower proinflammatory transcription.
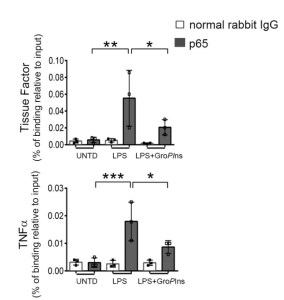
Figure labels: normal rabbit IgG; binding relative to input (%); UNTD = untreated.
Original Figure 5D. ChIP; GroPIns 300 μM for 20 minutes before LPS 0.1 μg/mL for 60 minutes. TF is a separate mechanistic endpoint.
Vessichelli M et al. J Biol Chem. 2017;292:12828–12841. DOI: 10.1074/jbc.M116.773861. PMID: 28600357.
Mechanisms · Endogenous GroPIns research
Downregulation of proinflammatory gene expression
GroPIns reduces LPS-induced TNF-α, IL-1β and COX-2 transcription. IL-10 expression was not suppressed in this experiment.
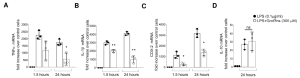
Original Figure 1A–D. Primary human monocytes; GroPIns 300 μM for 20 minutes before LPS 0.1 μg/mL; measurements at 1.5 and 24 hours.
Vessichelli M et al. J Biol Chem. 2017;292:12828–12841. DOI: 10.1074/jbc.M116.773861. PMID: 28600357.
Mechanisms · Endogenous GroPIns research
Reduced cytokine release across multiple donors
Protein-level results complement the transcriptional evidence.
At 24 hours, TNF-α release inhibition in the 3 donors shown ranged from 34.5% to 59.5%.
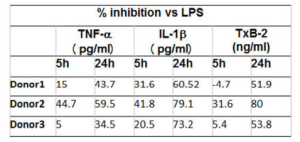
Figure table: inhibition versus LPS (%)
Donor 1
| Time | TNF-α | IL-1β | TxB2 |
| 5 h | 15 | 31.6 | -4.7 |
| 24 h | 43.7 | 60.52 | 51.9 |
Donor 2
| Time | TNF-α | IL-1β | TxB2 |
| 5 h | 44.7 | 41.8 | 31.6 |
| 24 h | 59.5 | 79.1 | 80 |
Donor 3
| Time | TNF-α | IL-1β | TxB2 |
| 5 h | 5 | 20.5 | 5.4 |
| 24 h | 34.5 | 73.2 | 53.8 |
The figure heading specifies percentage inhibition versus LPS. Original column headers also show pg/mL for TNF-α and IL-1β, and ng/mL for TxB2; these labels remain in the original image.
Original Figure 1G. Percentage inhibition relative to LPS stimulation; TNF-α, IL-1β and TxB2; GroPIns 300 μM.
Vessichelli M et al. J Biol Chem. 2017;292:12828–12841. DOI: 10.1074/jbc.M116.773861. PMID: 28600357.
Mechanisms · Further biology
A mechanistic extension into barrier biology
Beyond inflammatory signaling, GroPIns has also been studied in barrier biology.
In an endothelial–glial coculture model, transendothelial electrical resistance recovered after addition of GPI 100 μM.
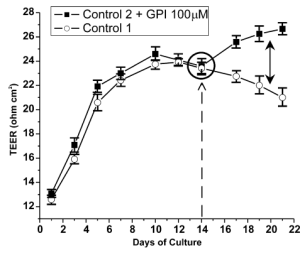
Figure labels: TEER; days of culture; control; GPI 100 μM treatment.
Original Figure 3. Blood–brain barrier coculture model, presented as a mechanistic extension. Skin-specific evidence follows in the epidermal-model and human-study sections.
Cucullo L et al. Brain Res. 2004;997:147–151. DOI: 10.1016/j.brainres.2003.09.079.
Cell and epidermal studies · GPI choline
Microscopy and quantitative results support reduced degranulation
GPI choline treatment reduced granules around the cells. Degranulation rates decreased significantly at both 0.1% and 0.3%.
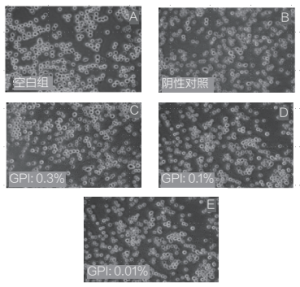
Image labels: A, blank control; B, positive/stimulated control; C–E, GPI 0.3%, 0.1% and 0.01%, respectively.
Degranulation rate
| RBL-2H3 condition | Degranulation rate |
| Stimulated control | 81.30% |
| GPI choline 0.1% | 70.10% |
| GPI choline 0.3% | 66.15% |
Left: original Figure 3; A, blank; B, stimulated; C–E, GPI 0.3%, 0.1% and 0.01%. Right: quantitative results reported in the text; P < 0.01 for both concentrations.
Wang Y, Zou Y. Detergent & Cosmetics. 2023;46(5):19–23. DOI: 10.3969/j.issn.1006-7264.2023.05.006.
Cell and epidermal studies · GPI choline
Significant reductions in TNF-α and IL-6 release
At the tested concentration of 0.3%, the paper reports TNF-α and IL-6 inhibition rates of 93.38% and 94.73%, respectively.
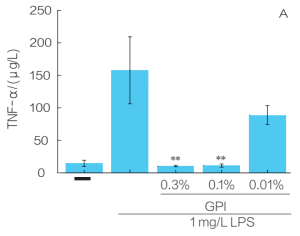
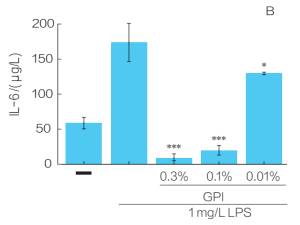
Original Figure 5A–B. PMA-differentiated THP-1 cells; LPS 1 mg/L for 24 hours; 3 parallel measurements. Concentrations are reported as in the source.
Wang Y, Zou Y. Detergent & Cosmetics. 2023;46(5):19–23. DOI: 10.3969/j.issn.1006-7264.2023.05.006.
Cell and epidermal studies · GPI choline
Effects on both IL-8 and IL-1β
Both endpoints decreased significantly at 0.1%–0.3%. At 0.3%, the reported IL-1β inhibition rate was 88.73%.
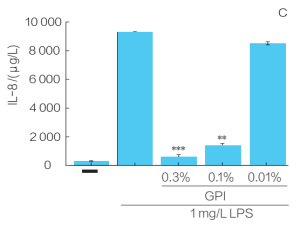
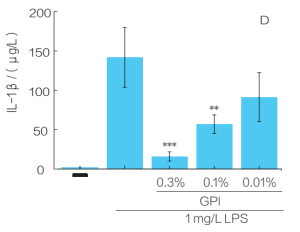
Original Figure 5C–D. PMA-differentiated THP-1 cells; LPS 1 mg/L for 24 hours. Original axes and significance marks retained.
Wang Y, Zou Y. Detergent & Cosmetics. 2023;46(5):19–23. DOI: 10.3969/j.issn.1006-7264.2023.05.006.
Cell and epidermal studies · GPI choline
Concentration-related responses across inflammatory markers
Significant inhibition was observed at 0.1%, with greater inhibition of some markers at 0.3%.
The table summarizes reported values to compare concentration responses across mediators.
| Reported inhibition | GPI sample 0.1% | GPI sample 0.3% |
| TNF-α | 92.86% | 93.38% |
| IL-6 | 88.48% | 94.73% |
| IL-1β | 59.85% | 88.73% |
Compiled from sections 2.1 and 2.3 of the paper. Inhibition is relative to the LPS-stimulated group. Experimental concentrations are not finished-product use recommendations.
Wang Y, Zou Y. Detergent & Cosmetics. 2023;46(5):19–23. DOI: 10.3969/j.issn.1006-7264.2023.05.006.
Cell and epidermal studies · GPI choline
Cell viability at efficacy-test concentrations
Across the 0.01%–0.3% range used in the inflammatory-mediator and degranulation experiments, relative viability remained above 90% in both cell types.
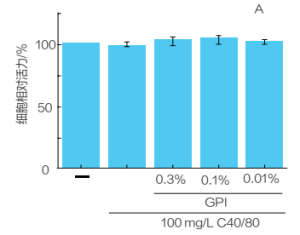
Chinese y-axis label: relative cell viability (%). Original groups, 100 mg/L C40/80 challenge and GPI concentrations are retained.
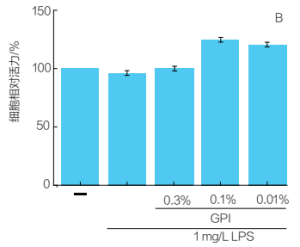
Chinese y-axis label: relative cell viability (%). Original LPS 1 mg/L challenge and GPI concentrations are retained.
Original Figure 2A–B. Left: RBL-2H3 mast cells. Right: THP-1-derived macrophages. Original axes and treatment groups retained.
Wang Y, Zou Y. Detergent & Cosmetics. 2023;46(5):19–23. DOI: 10.3969/j.issn.1006-7264.2023.05.006.
Cell and epidermal studies · Irritation models
Reduced PGE₂ release after UVB stimulation
Normal human epidermal keratinocytes were pretreated with GPI choline for 24 hours before UVB exposure.
The original figure shows lower PGE₂ release at higher tested concentrations, providing cell-level evidence for after-sun soothing concepts.
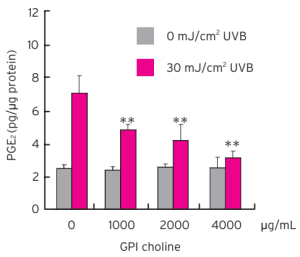
Original choline-salt experiment and significance marks retained. Concentration unit: μg/mL; PGE₂ normalized to protein content.
Glycerophosphoinositol Choline / Lysine technical brochure (2012), pp.4–5. Original technical-data figure.
Cell and epidermal studies · Irritation models
Concentration response of UVB-induced PGE₂ release
Normal human epidermal cells received UVB at 25 mJ/cm².
In the choline-salt group, PGE₂ decreased from 6.3 to 2.6, 2.2 and 1.8 pg/μg protein at 250, 500 and 1000 μM, respectively.
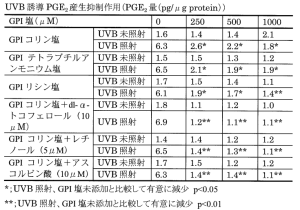
Translated Table 1: UVB-induced PGE₂ (pg/μg protein)
GPI choline salt
| GPI salt concentration (μM) | No UVB | UVB-exposed |
| 0 | 1.6 | 6.3 |
| 250 | 1.4 | 2.6* |
| 500 | 1.4 | 2.2* |
| 1000 | 2.1 | 1.8* |
GPI tetrabutylammonium salt
| GPI salt concentration (μM) | No UVB | UVB-exposed |
| 0 | 1.5 | 6.5 |
| 250 | 1.5 | 2.1* |
| 500 | 1.3 | 1.9* |
| 1000 | 1.2 | 1.9* |
GPI lysine salt
| GPI salt concentration (μM) | No UVB | UVB-exposed |
| 0 | 1.7 | 6.1 |
| 250 | 1.5 | 1.9* |
| 500 | 1.4 | 1.7* |
| 1000 | 1.1 | 1.4** |
GPI choline + dl-α-tocopherol (10 μM)
| GPI salt concentration (μM) | No UVB | UVB-exposed |
| 0 | 1.8 | 6.9 |
| 250 | 1.1 | 1.2** |
| 500 | 1.2 | 1.1** |
| 1000 | 1.0 | 1.1** |
GPI choline + retinol (5 μM)
| GPI salt concentration (μM) | No UVB | UVB-exposed |
| 0 | 1.4 | 6.5 |
| 250 | 1.4 | 1.4** |
| 500 | 1.2 | 1.3** |
| 1000 | 1.2 | 1.1** |
GPI choline + ascorbic acid (10 μM)
| GPI salt concentration (μM) | No UVB | UVB-exposed |
| 0 | 1.7 | 6.3 |
| 250 | 1.5 | 1.4** |
| 500 | 1.2 | 1.4** |
| 1000 | 1.2 | 1.1** |
* P<0.05; ** P<0.01, versus UVB-exposed cells without added GPI salt.
Original Table 1, retaining comparisons with other salts and combinations. * P < 0.05; ** P < 0.01, each versus UVB-exposed cells without added GPI.
JP2009269851A. 2009-11-19. Efficacy-study Examples 1–3.
Cell and epidermal studies · Irritation models
PGE₂ responses after capsaicin stimulation
PGE₂ release was measured after capsaicin stimulation of normal human epidermal cells.
At higher choline-salt concentrations, the difference between stimulated and unstimulated groups narrowed.
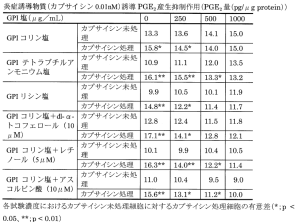
Translated Table 2: PGE₂ after capsaicin 0.01 nM (pg/μg protein)
GPI choline salt
| GPI salt concentration (μg/mL) | No capsaicin | Capsaicin-treated |
| 0 | 13.3 | 15.8* |
| 250 | 13.6 | 14.5* |
| 500 | 14.1 | 14.0 |
| 1000 | 15.0 | 15.0 |
GPI tetrabutylammonium salt
| GPI salt concentration (μg/mL) | No capsaicin | Capsaicin-treated |
| 0 | 10.9 | 16.1** |
| 250 | 11.1 | 15.5** |
| 500 | 12.0 | 13.3* |
| 1000 | 13.5 | 13.2 |
GPI lysine salt
| GPI salt concentration (μg/mL) | No capsaicin | Capsaicin-treated |
| 0 | 9.9 | 14.8** |
| 250 | 10.5 | 12.2* |
| 500 | 10.1 | 11.4 |
| 1000 | 11.9 | 11.7 |
GPI choline + dl-α-tocopherol (10 μM)
| GPI salt concentration (μg/mL) | No capsaicin | Capsaicin-treated |
| 0 | 12.8 | 17.1** |
| 250 | 12.4 | 14.1* |
| 500 | 11.5 | 12.8 |
| 1000 | 11.8 | 12.1 |
GPI choline + retinol (5 μM)
| GPI salt concentration (μg/mL) | No capsaicin | Capsaicin-treated |
| 0 | 10.1 | 16.3** |
| 250 | 9.9 | 14.0** |
| 500 | 10.4 | 12.2* |
| 1000 | 10.5 | 11.4 |
GPI choline + ascorbic acid (10 μM)
| GPI salt concentration (μg/mL) | No capsaicin | Capsaicin-treated |
| 0 | 11.0 | 15.6** |
| 250 | 10.4 | 13.1* |
| 500 | 9.5 | 11.2* |
| 1000 | 9.0 | 10.0 |
* P<0.05; ** P<0.01, capsaicin-treated versus untreated cells at the same tested concentration. Capsaicin concentration is retained as 0.01 nM from the supplied figure heading, without substitution based on typical experimental conditions.
Original Table 2. GPI-salt concentration: μg/mL. Asterisks compare stimulated and unstimulated cells at the same concentration, not the group without GPI.
JP2009269851A. 2009-11-19. Efficacy-study Examples 1–3.
Cell and epidermal studies · Irritation models
Reduced OAG-induced PGE₂ release
With OAG stimulation at 250 μM, PGE₂ readings in the choline-salt group decreased as the tested concentration increased.
The original table also reports unstimulated and combination groups.
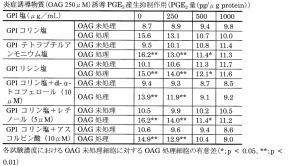
Translated Table 3: PGE₂ after OAG 250 μM (pg/μg protein)
GPI choline salt
| GPI salt concentration (μg/mL) | No OAG | OAG-treated |
| 0 | 8.7 | 15.6 |
| 250 | 8.9 | 13.1 |
| 500 | 9.4 | 10.7 |
| 1000 | 9.8 | 10.0 |
GPI tetrabutylammonium salt
| GPI salt concentration (μg/mL) | No OAG | OAG-treated |
| 0 | 9.5 | 16.2** |
| 250 | 10.1 | 13.0** |
| 500 | 10.8 | 11.4* |
| 1000 | 11.4 | 11.3 |
GPI lysine salt
| GPI salt concentration (μg/mL) | No OAG | OAG-treated |
| 0 | 10.1 | 15.0** |
| 250 | 10.6 | 14.0** |
| 500 | 11.3 | 12.1* |
| 1000 | 11.7 | 11.6 |
GPI choline + dl-α-tocopherol (10 μM)
| GPI salt concentration (μg/mL) | No OAG | OAG-treated |
| 0 | 9.4 | 13.9** |
| 250 | 9.3 | 11.9** |
| 500 | 8.7 | 9.1 |
| 1000 | 8.5 | 9.2 |
GPI choline + retinol (5 μM)
| GPI salt concentration (μg/mL) | No OAG | OAG-treated |
| 0 | 10.5 | 16.2** |
| 250 | 9.9 | 14.0** |
| 500 | 10.2 | 11.4* |
| 1000 | 10.5 | 11.2 |
GPI choline + ascorbic acid (10 μM)
| GPI salt concentration (μg/mL) | No OAG | OAG-treated |
| 0 | 10.6 | 14.9** |
| 250 | 9.6 | 12.9** |
| 500 | 9.4 | 10.4 |
| 1000 | 8.6 | 9.0 |
* P<0.05; ** P<0.01, OAG-treated versus untreated cells at the same tested concentration.
Original Table 3. OAG: 1-oleoyl-2-acetyl-sn-glycerol. Original values, concentration units and statistical marks retained.
JP2009269851A. 2009-11-19. Efficacy-study Examples 1–3.
Cell and epidermal studies · Irritation models
Reduced IL-1α release after surfactant irritation
Reconstructed human epidermis was challenged with SLS 0.5%, comparing mediator release with and without GPI choline 1%.
The combined-treatment group showed lower IL-1α, supporting development of mild-cleansing and soothing-care concepts.
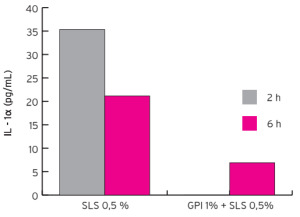
Original readings at 2 h and 6 h retained. SLS: sodium lauryl sulfate. Experimental concentrations follow the technical source.
Glycerophosphoinositol Choline / Lysine technical brochure (2012), pp.4–5. Original technical-data figure.
Animal studies · GroPIns
GroPIns reduces inflammatory mediators and cell-activation markers in mice
Male C57BL/6J mice, 9 per group; blood collected 2 h after LPS 1 mg/kg.
GroPIns 10 mg/kg per intraperitoneal dose was administered 3 times: 15 min before, at the same time as, and 60 min after stimulation.
Both TNF-α and Mac-1 decreased.
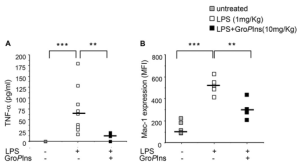
Original Figure 6A–B. Males aged 9–12 weeks; free GroPIns. In vivo endpoints in a systemic inflammation model, not a topical skin study.
Vessichelli M et al. J Biol Chem. 2017;292:12828–12841. DOI: 10.1074/jbc.M116.773861. PMID: 28600357.
Animal studies · GPI lysine combinations
Animal skin research with a related salt: ear photographs
21 dogs with atopic-dermatitis-associated otitis externa received a combination lotion twice daily for 14 days.
The formulation contained GPI lysine salt, a lactoferrin peptide and verbascoside.
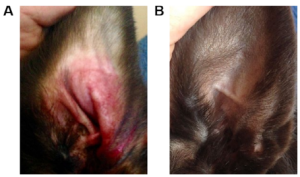
A: day 0; B: day 14.
Original Figure 5. A: day 0; B: day 14. The study used a GPI lysine-salt combination lotion, distinct from this product’s choline salt.
Accomasso L et al. Clin Dermatol Res J. 2017;2(1):1000112. Figs. 1–5.
Animal studies · GPI lysine combinations
Changes in canine skin-lesion scores and score distribution
In the same 21-dog study, CADESI scores decreased after 14 days and the distribution shifted toward lower scores.
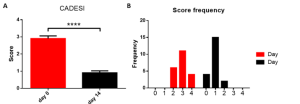
Figure labels: score; score frequency; day 0 and day 14.
Original Figure 1. Red: day 0; black: day 14. Mean ± SD; **** P < 0.0001. GPI lysine-salt combination lotion.
Accomasso L et al. Clin Dermatol Res J. 2017;2(1):1000112. Figs. 1–5.
Animal studies · GPI lysine combinations
Lichenification, excoriation, alopecia and pruritus scores
The same study assessed lichenification, excoriation, alopecia and pruritus.
All four scores decreased after 14 days, complementing the ear photographs and overall lesion scores.
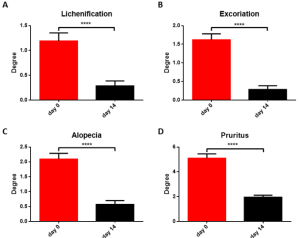
Figure labels: lichenification; excoriation; alopecia; pruritus; degree.
Original Figure 2A–D. Day 0 versus day 14; mean ± SD; **** P < 0.0001. Alopecia scores cannot be extrapolated to human hair-growth efficacy.
Accomasso L et al. Clin Dermatol Res J. 2017;2(1):1000112. Figs. 1–5.
Animal studies · GPI lysine combinations
Shed corneocyte, bacterial and Malassezia scores
Ear cytology in the same study assessed changes in shed corneocytes, bacteria and Malassezia.
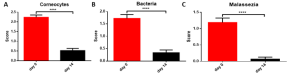
Figure labels: corneocytes; bacteria; Malassezia; degree.
Original Figure 3A–C. 21 dogs, 14 days; mean ± SD; **** P < 0.0001. The combination’s effects cannot be attributed to antimicrobial activity of GPI alone.
Accomasso L et al. Clin Dermatol Res J. 2017;2(1):1000112. Figs. 1–5.
Human skin studies · UVB erythema
Approximately 60% erythema inhibition with a GPI choline formulation
20 participants received 2 MED UVB on the forearm.
A GPI choline 0.25% formulation was applied for 6 hours, with erythema monitored by reflectance spectrophotometry over 48 hours.
The technical brochure reports approximately 60% erythema inhibition.
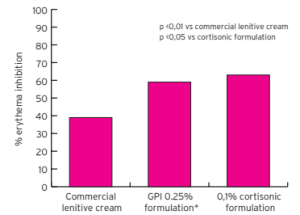
Figure labels: erythema inhibition (%); commercial lenitive cream; GPI 0.25% formulation; 0.1% cortisonic formulation. Original P values and comparison groups retained.
Original comparison of three formulations and statistical marks retained. Results apply to the tested topical formulation. MED: minimal erythema dose.
Glycerophosphoinositol Choline / Lysine technical brochure (2012), p.5. Human UVB erythema study.
Human skin studies · UVB erythema
Erythema observations with GPI choline 0.5% and 1.0% formulations
Adult male backs received UV exposure at 1.5 MED.
Original grayscale photographs at 6, 24 and 48 hours show local skin appearance with placebo and two GPI formulations.
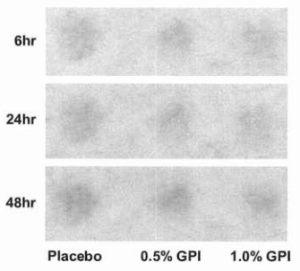
Figure labels: placebo; 6, 24 and 48 h; 0.5% GPI and 1.0% GPI formulations.
Original Figure 1. Patent grayscale and image quality retained. The patent does not clearly report sample size; the photographs illustrate the local observations shown.
JP2009269851A. 2009-11-19. Efficacy-study Examples 1–3.
Human skin studies · UVB erythema
Time course of erythema colorimetry and local blood flow
The same study used Δa* and local blood-flow measurements to complement visual observations.
The original table marks significant differences versus placebo at specific concentrations and times.
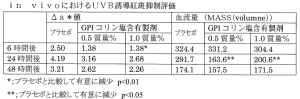
Translated Table 4: in vivo UVB-induced erythema assessment
Δa* values
| Time | Placebo | GPI 0.5 wt% | GPI 1.0 wt% |
| 6 h | 2.50 | 1.38 | 1.38* |
| 24 h | 4.19 | 3.16 | 2.68 |
| 48 h | 3.21 | 2.62 | 2.26 |
Blood flow: MASS(volume)
| Time | Placebo | GPI 0.5 wt% | GPI 1.0 wt% |
| 6 h | 324.4 | 331.2* | 304.4 |
| 24 h | 291.7 | 163.6** | 200.6** |
| 48 h | 174.1 | 157.5 | 171.5 |
Blood flow: MASS(volume). Patent definitions: * P<0.01; ** P<0.05 versus placebo. Original values and marks are retained without recalculation or correction.
Original Table 4. Patent definitions: * P < 0.01; ** P < 0.05. Blood-flow units retained as MASS(volume).
JP2009269851A. 2009-11-19. Efficacy-study Examples 1–3.
Human skin studies · 30-participant AD observation
A 30-participant, 4-week observation: improved lesions and pruritus
30 participants aged 4–16 years with mild-to-moderate atopic dermatitis used a formulation containing GPI choline and Perilla extract twice daily.
Mean EASI: 5.01 to 1.35
Pruritus VAS: 4.05 to 1.67
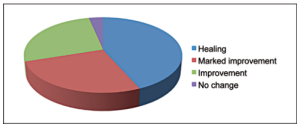
Figure legend: healing; marked improvement; improvement; no change.
Original Figure 1. Open-label, multicenter observation: 13 rated healed, 8 markedly improved, 8 improved and 1 unchanged. Five participants used rescue medication for one week.
Di Lernia V et al. G Ital Dermatol Venereol. 2011;146(Suppl. 2 to No. 6):1–5.
Human skin studies · 30-participant AD observation
Lesion appearance in two participants after 4 weeks
Left: patient 9, EASI 12.4 to 7.6. Right: patient 7, EASI 6.2 to 2.7. Within each pair, A is baseline and B is after 4 weeks.
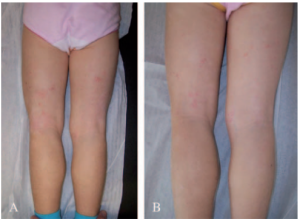
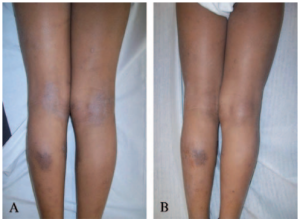
Original Figures 2–3; lesions and colors unretouched. Table I records rescue-medication use in both cases. Results apply to the study formulation and treatment conditions.
Di Lernia V et al. G Ital Dermatol Venereol. 2011;146(Suppl. 2 to No. 6):1–5.
Human skin studies · 300-participant AD observation
A 300-participant observation: pruritus improvement in adults and children
An observational study enrolled 300 patients with moderate atopic dermatitis.
A GPI choline-containing emollient ointment reduced total pruritus scores:
Adults: 7.90 to 4.46
Children: 9.10 to 5.86
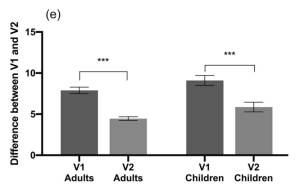
Figure labels: adults; children; V1/V2 = first visit/follow-up.
Original Figure 1e. Mean ± SEM; follow-up 33.69 ± 8.49 days; GPI group: 95 adults and 51 children; p < 0.001. The study evaluated a combination emollient ointment.
Marko M, Pawliczak R. J Dermatolog Treat. 2022;33(2):999–1010. DOI: 10.1080/09546634.2020.1800567. PMID: 32746664.
Human skin studies · 300-participant AD observation
Improved pruritus and sleep-related burden
The same study reported improvements in pruritus distribution, sleep disturbance, episode frequency and severity.
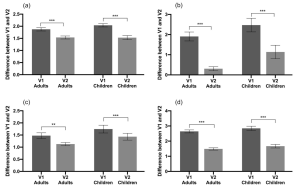
Original Figure 1a–d: distribution, sleep disturbance, frequency and severity, respectively. V1/V2: first visit/follow-up; mean ± SEM. The formulation contained other functional ingredients.
Marko M, Pawliczak R. J Dermatolog Treat. 2022;33(2):999–1010. DOI: 10.1080/09546634.2020.1800567. PMID: 32746664.
Human skin studies · 300-participant AD observation
Improved clinical scores with the GPI-containing emollient
Adult EASI decreased from 25.18 to 11.96 and pruritus VAS from 5.82 to 3.40, informing development of soothing GPI emollient systems.
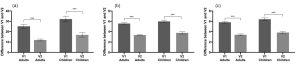
Original Figure 2: EASI, TIS and VAS. Open-label observational study in atopic dermatitis. Results apply to the complete formulation and cannot be attributed to GPI alone.
Marko M, Pawliczak R. J Dermatolog Treat. 2022;33(2):999–1010. DOI: 10.1080/09546634.2020.1800567. PMID: 32746664.
Human skin studies · 300-participant AD observation
Greater EASI, TIS and VAS improvements in the GPI-formulation group
The original figure compares score changes between visits, separately for adults and children.
The GPI emollient group improved more than the comparator emollient group on all three measures.
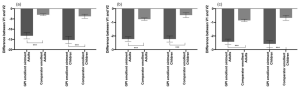
Figure labels: GPI emollient ointment; comparator emollient; adults and children. Negative changes indicate improvement from baseline.
Original Figure 8. A: EASI; B: TIS; C: VAS. Mean ± SEM; *** P < 0.001. Unblinded observational comparison of complete formulations.
Marko M, Pawliczak R. J Dermatolog Treat. 2022;33(2):999–1010. DOI: 10.1080/09546634.2020.1800567. PMID: 32746664.
Human skin studies · 300-participant AD observation
Between-group comparisons of total pruritus and sleep disturbance
The GPI-formulation group showed larger reductions in total pruritus scores and sleep disturbance.
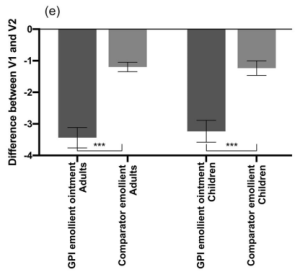
Figure labels: GPI emollient ointment; comparator emollient; adults; children.
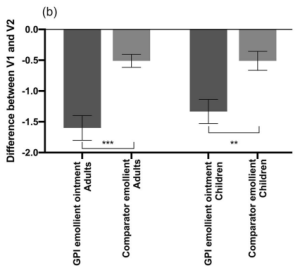
Figure labels: GPI emollient ointment; comparator emollient; adults; children.
Original Figures 7e and 7b. Left: total pruritus score; right: sleep disturbance. Negative values indicate improvement from baseline. Original statistical marks retained.
Marko M, Pawliczak R. J Dermatolog Treat. 2022;33(2):999–1010. DOI: 10.1080/09546634.2020.1800567. PMID: 32746664.
Human skin studies · 300-participant AD observation
Subjective ratings of use experience and symptom improvement
The study also recorded texture, spreading, absorption, product performance and symptom-relief ratings.
Differences between formulations in some items may inform formulation experience design.
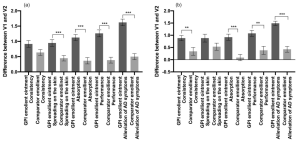
Original Figure 9. Left: adults; right: children. Not all items differed significantly between groups; consult the original marks.
Marko M, Pawliczak R. J Dermatolog Treat. 2022;33(2):999–1010. DOI: 10.1080/09546634.2020.1800567. PMID: 32746664.
Human skin studies · Other conditions
A 60-day observation of lesions, redness, pruritus and TEWL
30 participants with mild-to-moderate psoriasis used a GPI choline 1% cream twice daily for 60 days.
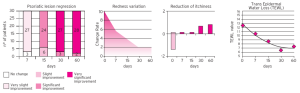
Figure labels: psoriatic lesion regression; redness variation; reduction of itchiness; transepidermal water loss; days.
Original panels: lesion-improvement grade, redness, pruritus and transepidermal water loss (TEWL). Formulation observations in a specific skin condition.
Falconi Klein E, Carrera C, Richelmi P. University of Pavia, May 2003, report 0201L07-05F. Cited via the technical brochure (2012), p.5.
Human skin studies · Other conditions
A GPI combination gel improves facial scaling, erythema and pruritus
25 participants with mild-to-moderate facial seborrheic dermatitis; open-label prospective study, twice-daily use for 45 days.
| Assessment | Reported result |
| Scaling, erythema and pruritus | All decreased significantly, P < 0.001 |
| Investigator global assessment | 47.9% achieved >80% improvement |
| Assessment methods | Clinical scores, erythema-directed photography and pruritus VAS |
| Formulation | GPI, piroctone olamine, lactoferrin and aloe vera |
Results apply to the complete combination gel. The abstract identifies GPI without specifying its salt form. This does not quantify the efficacy of choline salt alone.
Dall’Oglio F et al. G Ital Dermatol Venereol. 2017;152(5):436–440. DOI: 10.23736/S0392-0488.17.05539-0. PMID: 28121079.
Human scalp study · 30-day observation
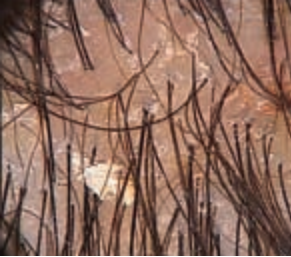
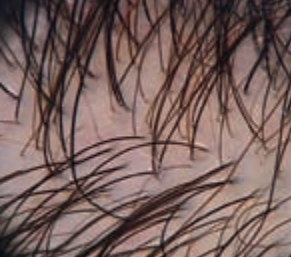
Scalp appearance after 30 days
10 participants with dandruff and seborrheic dermatitis used a GPI choline 0.25% lotion once daily.
Participant 1
Before use
After 30 days
Participant 2
Before use
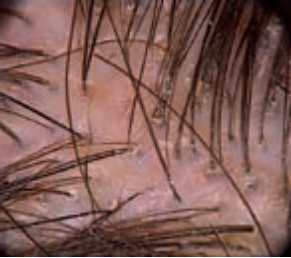
After 30 days
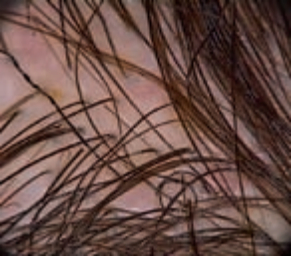
Two participants from the same study. Original paired scalp-dermoscopy images are shown before and after use. Observations apply to the tested lotion.
Pazzaglia M, Tosti A. Scalp dermatoscopy study report. University of Bologna, January 2007. Original images cited via the supplied technical brochure (2012), p.6.
Human scalp study · 30-day observation
Distribution of improvement in dandruff, redness and pruritus
The same 30-day study also assessed dandruff, redness, pruritus and sebum.
The original figure shows participant proportions in each improvement category, complementing the dermoscopy observations.
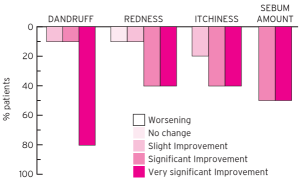
Figure labels: dandruff; redness; itchiness; sebum amount; patients (%). Legend: worsening, no change, slight improvement, significant improvement, very significant improvement.
Original assessment figure. n = 10; GPI choline 0.25% lotion, once daily for 30 days. Original grading and participant proportions retained.
Pazzaglia M, Tosti A. Scalp dermatoscopy study report. University of Bologna, January 2007. Original figure cited via the supplied technical brochure (2012), p.6.
Applications · Formulation directions
Formulation applications for skin and scalp care
Calculate active addition from the selected ingredient’s specifications.
Validate stability, compatibility and sensory properties in the target formulation.
| Format | Facial serum |
| Product concept | Daily soothing for sensitive skin |
| Development focus | Low stinging and comfortable skin feel |
| Format | Face / body cream |
| Product concept | Soothing emollient care |
| Development focus | Balance of hydration and emollience |
| Format | After-sun lotion |
| Product concept | Comfort after sun exposure |
| Development focus | Tolerance on irritated skin |
| Format | Scalp serum |
| Product concept | Lightweight leave-on care |
| Development focus | Scalp contact and low residue |
| Format | Mild shampoo |
| Product concept | Cleansing and scalp comfort |
| Development focus | Mild surfactant system and scalp tolerance |
These are formulation-development concepts. Use level, pH and processing conditions should follow the applicable PuriPharm product technical specifications.
Applications · Product value
PuriActives® GPI Glycerophosphoinositol Choline
Sunflower-derived, produced by enzymatic bioconversion
Cellular mechanisms, animal research and human formulation observations support development of soothing skin and scalp care.
PuriPharm Co. Ltd.
References
References: molecular mechanisms and cell studies
Wang Y, Zou Y. Detergent & Cosmetics. 2023;46(5):19–23. DOI: 10.3969/j.issn.1006-7264.2023.05.006.
Vessichelli M et al. J Biol Chem. 2017;292:12828–12841. DOI: 10.1074/jbc.M116.773861. PMID: 28600357.
Corda D et al. Biochim Biophys Acta. 2002;1582:52–69. DOI: 10.1016/S1388-1981(02)00137-3.
Corda D et al. Biochem Soc Trans. 2012;40:101–107. DOI: 10.1042/BST20110679.
Cucullo L et al. Brain Res. 2004;997:147–151. DOI: 10.1016/j.brainres.2003.09.079.
References
References: human skin and scalp studies
Marko M, Pawliczak R. J Dermatolog Treat. 2022;33(2):999–1010. DOI: 10.1080/09546634.2020.1800567. PMID: 32746664.
Di Lernia V et al. G Ital Dermatol Venereol. 2011;146(Suppl. 2 to No. 6):1–5.
Dall’Oglio F et al. G Ital Dermatol Venereol. 2017;152(5):436–440. DOI: 10.23736/S0392-0488.17.05539-0. PMID: 28121079.
Glycerophosphoinositol Choline / Lysine technical brochure (2012), pp.4–6.
Pazzaglia M, Tosti A. University of Bologna, January 2007.
Falconi Klein E et al. University of Pavia, May 2003. Report 0201L07-05F.
References
References: efficacy patent and related-salt studies
JP2009269851A. 2009-11-19.
Efficacy-study Examples 1–3; original Tables 1–4 and Figure 1.
Accomasso L et al. Clin Dermatol Res J. 2017;2(1):1000112. Figs. 1–5.
Animal study of a GPI lysine-salt combination lotion.
PubChem. Glycerophosphoinositol choline. CID 91936944. https://pubchem.ncbi.nlm.nih.gov/compound/91936944