PuriActives® SPG

PuriActives® SPG

SCHIZOPHYLLAN / SPG

PuriPharm Co. Ltd.

Schizophyllan: Two Grades, Physicochemical Properties and Care Applications

Two grades, triple-helix rheology, and evidence for antioxidant, repair and oral-care applications

Two grades · Original research figures · Measured data · Application value

Marketing and technical presentation / 2026

STRUCTURE → FUNCTION
β-(1→3) backboneβ-(1→6) side groups · Triple helix in water

INCI: SCHIZOPHYLLANBrand: PuriActives® SPG

Overview

PuriActives® SPG: Product Highlights

Two molecular-weight grades supported by structural, antioxidant, repair and oral-care evidence

A versatile polysaccharide platform for skincare and oral-care development

Area
Evidence and properties
Customer value
Marketing value
Physicochemical properties
Triple helix, rheology, molecular weight and receptor studies
High molecular weight for structure and texture; low molecular weight for formulation flexibility
Adaptable to serums, gels and care products
Skincare
Chemical, cellular, zebrafish and mouse studies
Antioxidant activity, cell protection, skin-tone care and repair
Evidence across models supports differentiated skincare development
Oral care
In vitro studies in HGF and macrophages
Cell viability, migration and IL-10 pathway activation
Mechanistic evidence supports oral and gingival care development
Formulation
Solutions, power-law fluids, weak gels and thermoreversible gels
Adjustable viscosity, hydration, gelation and texture
Suitable for a range of skincare and oral-care systems

PuriActives® SPG combines grade flexibility, evidence across experimental models and broad application potential.

Original research figures, experimental conditions and references are retained throughout.

Two Grades and Physicochemical Properties

SPG: Identity, Sources and Product Value

PuriActives® SPG is a schizophyllan ingredient with a defined structure, controlled specifications and comprehensive characterization.

Biological sources

Polysaccharides can be obtained from Schizophyllum commune fruiting bodies or submerged fermentation. Strain, medium and isolation process jointly determine product quality.

Schizophyllan (SPG)

The classical structure is a β-(1→3)-D-glucan backbone with one β-(1→6)-glucose side group on every third backbone glucose.Characterization of the backbone, branching and conformation establishes product identity.

Fungal extract

Fungal extracts contain polysaccharides, proteins, small molecules and other cellular components.PuriActives® SPG focuses on defined SPG identity, composition and molecular-weight characterization.

Defined strains, fermentation and purification processes support specification control and formulation development.

Kuttel et al., Biophys J, 2007, PMC1896245;He et al., Front Pharmacol, 2025, DOI:10.3389/fphar.2025.1562839

PuriActives® SPG: Two Product Grades

The same schizophyllan backbone is used to create two distinct grades through molecular-weight control.

Shared structure: β-(1→3) backbone with one β-(1→6)-glucose side group per three backbone residues

High-molecular-weight grade

High-MW SPG: Structure and material performance

  • Long chains and triple-helical conformation provide structural performance.
  • Focus: viscosity, shear thinning, gelation and film formation.
  • Suitable for thickening, gel and film-forming systems.

Upgraded low-molecular-weight grade

Low-MW SPG: Chain length and biological response

  • A distinct upgraded grade produced through molecular-weight control.
  • Characterize degree of polymerization, distribution, conformation and receptor response.
  • Suitable for low-viscosity systems and chain-length-oriented product design.

The two grades allow formulators to tailor rheology, texture and biological-response studies.

The two grades emphasize structural rheology and formulation flexibility, respectively, allowing selection for different products.

Original Structure Figure: Backbone and Branching

An excerpt from Figure 1a of a 2021 structural review compares linkages in linear glucans and schizophyllan.
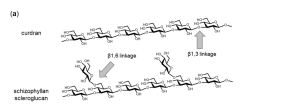
Original English labels retained: curdlan has a linear backbone; schizophyllan/scleroglucan shows a β1,3 backbone with β1,6 side chains.

Backbone

β-(1→3) glycosidic bonds form the glucose backbone.

Branching

One monosaccharide side group is attached per three SPG backbone residues.

Structural parameters

Backbone length, branch spacing and side chains jointly influence higher-order structure.

Manabe & Yamaguchi, Int J Mol Sci, 2021, 22:1578, Figure 1a, DOI:10.3390/ijms22041578 (CC BY 4.0)

Repeating Unit: Backbone Structure and Water-Facing Side Groups

Structural schematic redrawn from Kuttel et al., Figure 1
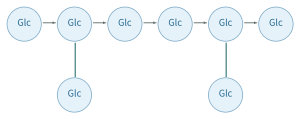
β-(1→3)-D-glucan backbone

One β-(1→6)-glucose side group is attached to every third backbone glucose.

Interpreting the structure

  • Three backbones form a rigid triple helix through interchain hydrogen bonds.
  • Side groups face outward and interact with water.
  • Side-group hydration promotes dispersion and dissolution in water.
  • These structural features support thickening, gelation and film formation.

Kuttel et al., Explicit-Solvent Molecular Dynamics Simulations of the Polysaccharide Schizophyllan in Water, PMC1896245

Triple Helix and Hydration: Cooperative Interchain Rigidity

Redrawn from Kuttel et al., Figure 1. Persistence length is a structural parameter discussed in the molecular-simulation study.
Outer Glc side groups interact with water; interchain hydrogen bonds maintain the triple helix.

Persistence length: 150–200 nm

A rigid triple helix in water supports high viscosity and characteristic rheological behavior.

Triple-helix stability up to 120 °C

The aqueous triple helix is reported as stable up to 120 °C. The reversible state transition at 7 °C is a separate conformational process.

Formulation value

Triple-helix rigidity and hydration support thickening, gelation and film formation.

Schematic based on Kuttel et al., 2007

Kuttel et al., Biophys J, 2007, PMC1896245. For triple-helix stability and transition temperatures, see the experimental literature reviewed in that paper.

Solution Conformation: Effects of Temperature, Solvent and Concentration

Temperature, solvent and concentration provide practical ways to control SPG conformation.

In water: Ordered triple helix

Interchain hydrogen bonds maintain a rigid triple helix.The reversible state transition at 7 °C and the high-temperature stability range provide distinct windows for conformational control.

Heat and solvent: Conformational rearrangement

The aqueous triple helix remains stable at temperatures up to 120 °C.Denaturation–renaturation can alter aggregation and rheology.

Cooling and polyols: Gelation

Cooling the SPG/sorbitol system produces a thermoreversible gel accompanied by a triple-helix II→I transition.

Formulation value: Dissolution temperature, solvent composition, concentration and renaturation history jointly control molecular conformation and product texture.

Kuttel et al., 2007;Fang & Nishinari, 2004, DOI:10.1002/bip.10514;Fang et al., PMID:15211499

Power-Law Behavior and Shear Thinning

A 1% SPG solution behaves as a non-Newtonian, pseudoplastic fluid.

η = K γ̇ⁿ⁻¹

n < 1: shear thinningK: consistency index

1% dried SPG sample

21.05 mPa·sShear rate: 27.05 s⁻¹168 h sample: Mw = 5.54 × 10⁵ Da
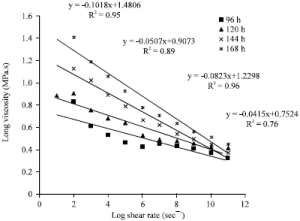
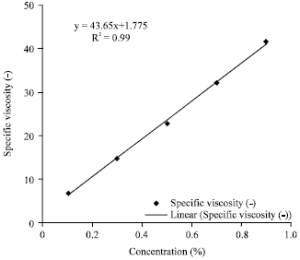
Original Figure 3: Viscosity versus shear rate for 1% SPG. Figure 4: The slide caption calls this reduced viscosity versus concentration, while the original graph axis is labeled Specific viscosity. These are different terms.

Kumar & Singhal, Am J Food Technol, 2011, Figures 3–4, DOI:10.3923/ajft.2011.781.789

Fermentation Rheology: From Near-Newtonian Flow to Shear Thinning

Biomass, SPG accumulation and molecular weight jointly change the flow behavior of the fermentation broth.
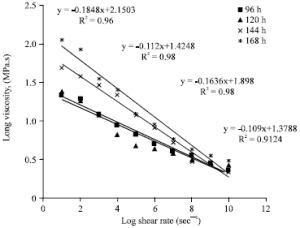
Original Figure 1: viscosity versus shear rate at 96, 120, 144 and 168 h

Original Table 2: Power-law parameters

Time (h)
Flow behavior index n
Consistency index K (mPa·s)
48
1.09
12.20
72
1.02
18.90
96
0.98
25.50
120
0.89
58.00
144
0.84
77.73
168
0.81
141.30

Rheological value

As fermentation proceeds, n decreases and K increases, indicating stronger shear thinning.The gradual transition at 72–96 h links SPG accumulation with flow behavior.

Kumar & Singhal, 2011, Figure 1 and Table 2, DOI:10.3923/ajft.2011.781.789

Weak Gels and Thermoreversible SPG/Sorbitol Gels

Solutions, weak gels and thermoreversible gels correspond to different structural conditions.

Denatured–renatured SPG: Concentration dependence

Concentration
Rheological state
> 0.75 wt%
Weak-gel rheology
0.28–0.65 wt%
Power-law fluid
≤ 0.19 wt%
Newtonian fluid

SPG/sorbitol system

Cooling → thermoreversible gelCooling drives the triple-helix II→I transition and gel formation.The SPG/sorbitol ratio, molecular weight and thermal history jointly control gel strength and reversible texture.

Formulation value: Solutions, weak gels and thermoreversible gels offer texture options for serums, masks and gel-based care products.

Fang et al., 2004, PMID:15211499;Fang & Nishinari, 2004, DOI:10.1002/bip.10514

High-MW Grade: Triple Helix and Solution Rheology

Long-chain higher-order structure connects molecular conformation with formulation performance.
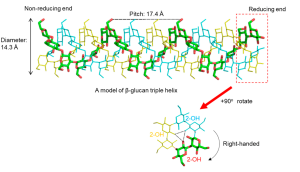
Original Figure 2: Right-handed triple-helix model, pitch and interchain 2-OH hydrogen bonds

Long-chain higher-order structure

Long-chain β-glucans can form triple helices. Schizophyllan adopts a semiflexible rod-like conformation.

Material performance

Molecular rigidity and interchain interactions provide a structural basis for high viscosity, shear thinning and gelation.

Key specification criteria

Record molecular-weight distribution, conformation, rheological curves and sample-preparation history together.

At molecular weights above 50,000 Da, the triple helix forms an ordered conformation associated with high viscosity.

Manabe & Yamaguchi, 2021, Figure 2;Kuttel et al., 2007;Kumar & Singhal, 2011

Upgraded Low-MW Grade: Rebalancing Chain Length and Conformation

Molecular-weight control creates a distinct low-MW grade and shifts the focus of characterization and evaluation.

High-MW long chains

Prominent triple-helix and rheological properties

Controlled molecular-weight adjustment

Changes in degree of polymerization and distribution

Upgraded low-MW grade

Chain length, conformation and application flexibility

What is retained?

  • Chemical features of the β-(1→3) backbone.
  • Structural features of β-(1→6) branching.
  • Confirmation by FTIR, NMR and related structural methods is required.

What changes?

  • Degree of polymerization and molecular-weight distribution.
  • Triple-helix proportion, morphology and solution viscosity.
  • Controlled degradation jointly affects chain length and chemical structure.

Application focus

  • Receptor recognition and cellular responses.
  • Antioxidant activity, repair and formulation stability.
  • Low-viscosity systems and chain-length-oriented product design.

The upgraded low-MW grade combines β-glucan structural features with tailored chain length, conformation and distribution to expand formulation options.

Manabe & Yamaguchi, 2021;He et al., 2025

Differences in Molecular Weight, Strain and Preparation

Molecular weight, strain and preparation history jointly shape conformation, viscosity and biological responses.
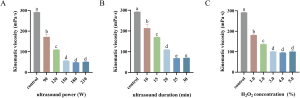
Original Figure 1: Effects of ultrasonic power, duration and H₂O₂ concentration on kinematic viscosity; N = 3

Sample
Weight-average molecular weight (Mw)
SPG-o
4,409,608 Da
SPG-a
257,500 Da
SPG-b
429,300 Da
SPG-c
364,800 Da

Strain and composition differences

The fermentation product of S. commune 5.43 is a heteropolysaccharide with a glucose:mannitol:galactose:fucose molar ratio of 86:8:5:1.

Molecular-weight range in the literature

Reported natural SPG molecular weights span 100–6,000 kDa. Measurement methods and post-processing define the resulting distribution.

He et al., 2025, Figure 1, DOI:10.3389/fphar.2025.1562839;Kuttel et al., 2007;Gou et al., 2023

Degradation Alters the Triple Helix and Morphology While Retaining Some Sugar-Structure Features

Controlled degradation jointly adjusts molecular weight, triple helices, morphology and solution behavior.
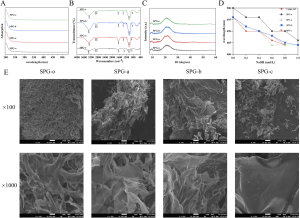
Original Figure 4: UV-Vis, FTIR, XRD, Congo red and SEM

Reading the figure

  • FTIR: Pyranose and β-glycosidic-bond features are retained.
  • Congo red: Degraded samples show disruption of triple-helical conformation.
  • SEM: Morphology shifts from fibrous to sheet-like.

Process-control value

Redissolution, ethanol reprecipitation and freeze–thaw treatment can be combined with molecular-weight adjustment to control purity, branching, solubility and viscosity.

He et al., 2025, Figure 4, DOI:10.3389/fphar.2025.1562839;Jamshidian et al., 2017, DOI:10.1016/j.ijbiomac.2017.06.110

Low-MW Characterization: GPC and MALDI-TOF

Original GPC and MALDI-TOF spectra show the molecular-weight distribution and oligosaccharide mass series.

GPC: Relative molecular-weight distribution
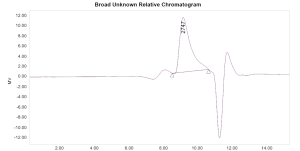
Original GPC chromatogram with retention-time axis and peak shape retained

GPC results: Mn 1777 Da; Mw 2420 Da; MP 2747 Da; Đ 1.361456Defined standards, column systems and detection conditions are required to report distributions and statistical parameters.

MALDI-TOF: Ion-peak series
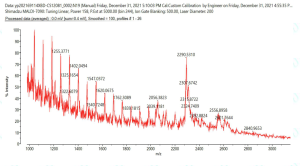
Original MALDI-TOF spectrum: Glucan degradation product A

Ion series at m/z 1000–3000 characterize oligosaccharide fragments. MALDI-TOF complements GPC by providing detailed mass-series information.

Complementary GPC and MALDI-TOF characterization supports low-MW SPG specification design.

Chain Length and Receptor Recognition: Structure-Driven Biological Responses

Dectin-1 binding depends on chain length. Branching and higher-order structure also matter.
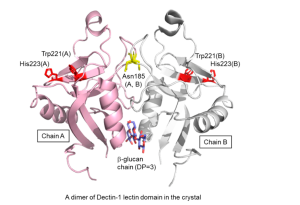
Original Figure 3: A DP = 3 trisaccharide captured in a crystal of dimeric Dectin-1 lectin domains illustrates the structural basis of receptor recognition.

10–11 sugar residues

Shortest chain length with detectable binding in glycan microarrays

DP 6: Weak binding

Short-chain response in NMR interaction studies

DP 16: Moderate binding

Increasing chain length is associated with secondary-structure formation.

Average DP 25: Stronger binding

Laminarin shows stronger binding; recognition occurs in the middle of the chain rather than at its ends.

Dectin-1 recognition integrates chain length, branching and higher-order conformation, informing SPG specification design.

Manabe & Yamaguchi, 2021, Figure 3;Palma et al., JBC, 2006;Hanashima et al., Glycoconj J, 2014

Formulation Selection: Balancing Molecular Weight, Viscosity and Conformation

Select high- or low-MW SPG according to target texture, conformation and application performance.

Variable
Formulation effect
Record alongside it
Formulation value
Molecular weight
Solution viscosity and cellular responses
Measurement method, distribution and degradation process
Choose chain length for target viscosity and biological response.
Concentration
Newtonian, power-law or weak-gel behavior
Shear-rate range and temperature
Adjust dosage to rheology, texture and dosage form.
Conformation
Hydration, aggregation and gelation
Solvent, thermal history and tests such as Congo red
Use solvent and thermal history to adjust hydration and gel behavior.
Post-processing
Purity, solubility and viscosity
Redissolution, precipitation and freeze–thaw history
Defined purification and drying controls support batch consistency.

Formulation-characterization panel

Appearance and dispersibility + molecular weight/distribution + viscosity–shear curves + pH/ions/polyols + concentration in the target model

Based on Kumar & Singhal, 2011; Fang et al., 2004; He et al., 2025; Jamshidian et al., 2017

Skincare Applications

Skincare Evidence: Antioxidant Activity and Repair Across Models

Chemical, cellular, animal and formulation evidence links mechanisms with product development.

Level
Model
Endpoints
Application value
Chemical systems
DPPH, ABTS and ·OH
Radical-scavenging rate
Three complementary radical-scavenging assays support antioxidant activity.
Cells
L929, B16F10, BJ and HaCaT
Viability after UVB, ROS/MDA/SOD, melanin and migration
Cell studies support protection, skin-tone care and repair applications.
Animals
Zebrafish caudal fin and full-thickness mouse wounds
Regenerated area and wound-healing rate
Animal models show tissue regeneration and wound closure.
Formulation
Solutions, weak gels and thermoreversible gels
Rheology, hydration and texture
Adaptable to serums, gels, masks and care products.

The two SPG grades combine evidence on antioxidant activity, cell protection and tissue repair to support skincare development.

Gou et al., 2023, DOI:10.1016/j.ijbiomac.2023.124504;He et al., 2025;Lei et al., 2025, DOI:10.1016/j.ijbiomac.2025.145816

NTU-1: High-Yield Fermentation and Efficacy Across Models

Controlled fermentation provides high SPG productivity and material for efficacy studies across models.

5 L fermenter: Process conditions

Parameter
Condition
Carbon source
Sucrose, 40 g/L
Nitrogen source
Yeast extract, 20 g/L
Culture conditions
pH 5.0; 28 °C
Additive
2,4-D, 0.2 mg/L

Fermentation results

7 days → 5 daysSPG yield: 21.3 g/L, combining a shorter fermentation cycle with high productivity

Efficacy evaluation across models

Chemical antioxidant assays: Best tested concentration, 2.0 mg/mLL929: UVB photodamage model, 20 mJ/cm²B16F10: Melanin-synthesis assay

NTU-1 combines high-yield fermentation, antioxidant activity and evidence from skin-related cell models.

Gou et al., Int J Biol Macromol, 2023, PMID:37080406, DOI:10.1016/j.ijbiomac.2023.124504

NTU-1 and Photoaging: The L929 UVB Cell Model

SPG at 1 mg/mL increases viability after UVB exposure and modulates ROS, MDA and SOD.
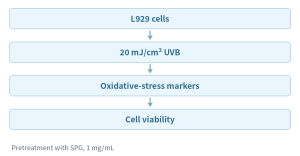
Cell viability

+23.5%Increase versus the control; the experiment used 1 mg/mL SPG pretreatment and a UVB injury model.

Oxidative stress

Reduced ROSAt 1 mg/mL, MDA decreased and SOD activity increased.

Skincare application value

Cell studies support antioxidant and photodamage-care applications.The combined responses of viability, ROS, MDA and SOD provide a mechanistic basis for protective skincare formulations.

Experimental workflow and data based on Gou et al., 2023

Gou et al., 2023, PMID:37080406, DOI:10.1016/j.ijbiomac.2023.124504. Experimental workflow and summary data reproduced from the source presentation.

NTU-1 in B16F10 Cells: Melanin-Related Skin-Tone Care

B16F10 cell findings demonstrate SPG activity relevant to skin-tone care.

Experimental model

B16F10 melanoma cellsSPG showed inhibitory activity related to melanin synthesis in B16F10 cells.This model provides a direct cellular assessment for skin-tone-care ingredients.

Observations

SPG showed inhibition related to melanin synthesis in the B16F10 cell model.These findings complement the NTU-1 antioxidant and UVB-protection data.

Skin-tone-care value

  • Melanin-synthesis-related inhibition in B16F10 cells.
  • Complementary antioxidant and cell-protection evidence.
  • Potential use in products targeting an even, brighter-looking skin tone.

PuriActives® SPG offers a polysaccharide option for skin-tone care, antioxidant and skin-conditioning products.

Gou et al., 2023, PMID:37080406, DOI:10.1016/j.ijbiomac.2023.124504. Based on the abstract and verifiable excerpts cited in the presentation.

Chemical Radical Scavenging by Degraded SPG

Degraded samples generally outperformed undegraded SPG-o. N = 3; values are mean ± SD.
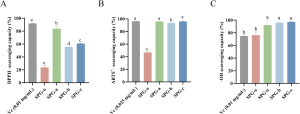
Original Figure 5: DPPH, ABTS⁺· and ·OH scavenging. Different letters indicate p < 0.05.

DPPH

SPG-a: 83.76 ± 3.68%SPG-b: 55.43 ± 0.55%; SPG-c: 60.55 ± 0.77%SPG-o: 20.37 ± 7.57%

ABTS⁺·

SPG-a: 95.79 ± 0.19%; SPG-b: 93.30 ± 0.67%SPG-c: 95.91 ± 0.58%SPG-o: 46.67 ± 0.85%

·OH

SPG-a: 92.00 ± 7.27%; SPG-b: 95.94 ± 1.83%SPG-c: 97.01 ± 1.09%; SPG-o: 76.26 ± 5.00%

Three complementary chemical assays demonstrate broad radical-scavenging activity and support positioning as an antioxidant ingredient.

He et al., 2025, Figure 5, DOI:10.3389/fphar.2025.1562839. Vc is the positive control.

BJ/HaCaT Proliferation: Cell-Type Differences Across Molecular Weights

CCK-8, 24 h; untreated control normalized to 100%; N = 3
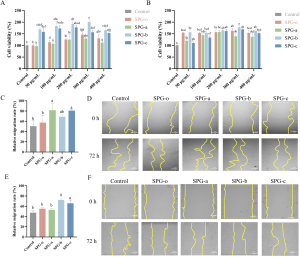
Original Figure 6A/B: 50–400 μg/mL; highlighted values are at 300 μg/mL.

BJ fibroblasts

SPG-b: 200.42% ± 11.00%300 μg/mL, 24 h

HaCaT keratinocytes

SPG-b: 177.62% ± 9.16%300 μg/mL, 24 h

Data reference: +53.69% and +14.59% in the abstract are relative to SPG-o. Values in the figure use the untreated control = 100%.

Additional EdU evidence: SPG-b, 50.90% ± 1.26%; SPG-c, 51.06% ± 0.88%, supporting DNA-synthesis activity.

He et al., 2025, Figures 6–7, DOI:10.3389/fphar.2025.1562839

Scratch Migration: Different Leading Samples in BJ and HaCaT Cells

The results text and figure legend report 300 μg/mL for 48 h; N = 3.
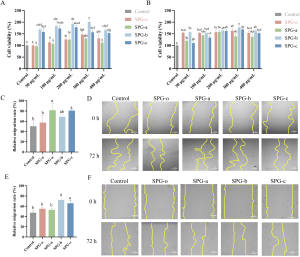
BJ: Significant effects with SPG-a/c

Untreated: 50.34 ± 10.51%a: 81.54 ± 13.78%c: 80.70 ± 1.92%

HaCaT: Significant effects with SPG-b/c

Untreated: 47.46 ± 3.75%b: 72.24 ± 6.67%c: 65.81 ± 6.20%

Results text and figure legend: 300 μg/mL, 48 h. Original microscopy panels are retained.

He et al., 2025, Figure 6C–F, DOI:10.3389/fphar.2025.1562839

Zebrafish Caudal-Fin Regeneration: Repair Evidence in an Animal Model

3.125 mg/mL, 72 h, N = 15; regenerated area reached 110.49% with SPG-c.
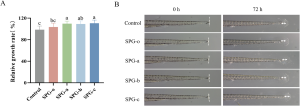
Regenerated area/rate, as reported in the original study

Untreated: 98.46 ± 6.91%SPG-o: 103.52 ± 7.18%SPG-a: 109.71 ± 4.81%SPG-b: 109.04 ± 5.79%SPG-c: 110.49 ± 5.94%

SPG-c increased the value by 6.97% relative to SPG-o.All SPG groups exceeded the untreated control (p < 0.05).

Repair application value

Animal regeneration data complement cell-proliferation and migration results, providing evidence across models for skincare development.

He et al., 2025, Figure 8, DOI:10.3389/fphar.2025.1562839

Full-Thickness Mouse Skin Wounds: 96.65% Healing at Day 18 with 4 mg/mL

SPG at 4 mg/mL achieved 96.65% closure at day 18 in a full-thickness mouse wound model.

Male BALB/c mice, 8 weeks old, 18–22 g

Circular full-thickness dorsal skin wounds, 8 mm; 3 mice per group

Group
Treatment
Untreated control
PBS
SPG
1, 2 and 4 mg/mL
Positive control
3M transparent dressing

Changed every 3 days; continuous observation

Efficacy result reported in the patent

4 mg/mL: 96.65%Wound-healing rate at day 18; positive control: 3M transparent dressing

Animal wound-closure data provide tissue-level evidence for SPG repair applications and formulation development.

Lei et al., 2025, PMID:40628325, DOI:10.1016/j.ijbiomac.2025.145816;CN119874951B

Skincare Conclusions: Antioxidant and Repair Evidence Across Models

Chemical, cellular and animal studies together support skincare applications.

Evidence across experimental levels

  • DPPH, ABTS⁺· and ·OH assays show broad radical-scavenging activity.
  • L929, BJ and HaCaT models show protection, proliferation and migration effects.
  • B16F10 findings support melanin-related skin-tone-care activity.
  • Zebrafish and mouse studies show tissue regeneration and wound closure.

Marketing value

  • Two grades meet different texture and application-design needs.
  • Three complementary assays support antioxidant activity.
  • Multiple models provide cell-protection and repair evidence.
  • Potential applications include skin-tone care, antioxidant and daily repair products.

The two SPG grades combine formulation flexibility with evidence on antioxidant activity, cell protection and tissue repair to support skincare development.

Based on Gou et al., 2023; He et al., 2025; Lei et al., 2025. Experimental models and original data are presented in the NTU-1 through mouse-wound sections above (source slides 20–27).

Oral Care

HGF Study Design: Viability, Proliferation and Migration

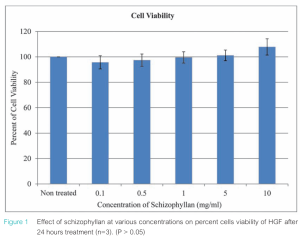
Human gingival fibroblasts; 0.1–10 mg/mL; n = 3

Experimental workflow

Defined observation windows

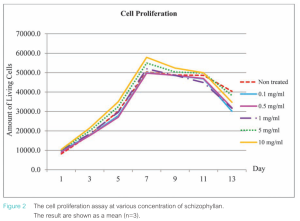
Between-group comparison at day 7 identifies proliferation differences. Figure 2 shows proliferation curves through day 13.

Concentration (mg/mL)
Cell viability (%) ± SD
Untreated
100.00 ± 0.00
0.1
95.69 ± 5.28
0.5
97.39 ± 4.98
1.0
99.57 ± 4.44
5.0
101.17 ± 4.22
10.0
107.85 ± 6.46

Mean ± SD, n = 3; P > 0.05.

Mala, Sacharoen & Surarit, M Dent J, 2017, Table 1 and Figure 1;he02.tci-thaijo.org/index.php/mdentjournal/article/view/180061

HGF Results: Dose Differences in Day-7 Proliferation and 24-h Migration

At 5 and 10 mg/mL, 24-h scratch migration was significantly higher than the control.

Day-7 proliferation: 5.7 × 10⁴ cells/well at 10 mg/mL

Concentration (mg/mL)
Day-7 proliferation (cells/well) ± SD
Untreated
5.0×10⁴ ± 1.3×10³ (a)
0.1
5.0×10⁴ ± 2.0×10³ (a)
0.5
4.9×10⁴ ± 0.8×10³ (a)
1.0
5.1×10⁴ ± 2.8×10³ (a,b)
5.0
5.4×10⁴ ± 1.9×10³ (a,b)
10.0
5.7×10⁴ ± 3.1×10³ (b)

Mean ± SD, n = 3; overall P < 0.05. Values sharing a letter are not significantly different (P > 0.05).
24-h migration: Control, 120 ± 5 cells/mm²

Concentration (mg/mL)
24-h migrated cells (cells/mm²) ± SD
Untreated
120 ± 5 (a)
0.1
116 ± 6 (a)
0.5
119 ± 5 (a)
1.0
124 ± 4 (a)
5.0
167 ± 7 (b)
10.0
204 ± 7 (c)

Mean ± SD, n = 3; overall P < 0.05. Values sharing a letter are not significantly different (P > 0.05).
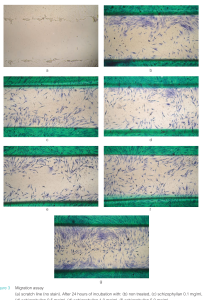
Dose-dependent HGF proliferation and migration findings support the potential of SPG in oral and gingival care products.

Mala et al., 2017, Tables 2–3 and Figures 2–3; n = 3. Statistical grouping letters and P values follow the original paper.

Periodontal-Pathogen LPS/IL-10: A Macrophage Signaling Pathway

SPG/Dectin-1 enhances LPS-induced IL-10 expression in J774.1 macrophages through coordinated signaling.
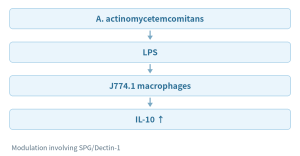
Signaling events

  • Prolonged NF-κB nuclear translocation.
  • Phosphorylation of Syk, MSK1 and CREB.
  • Enhanced LPS-induced IL-10 expression.

Oral-care application value

  • IL-10-related mechanisms support oral-care ingredient development.
  • Dectin-1, Syk, MSK1 and CREB define the signaling pathway.
  • HGF proliferation and migration evidence further supports gingival-care applications.

PuriActives® SPG combines fibroblast and macrophage evidence to support oral and gingival care product development.

Thongsiri et al., Carbohydr Polym, 2021, PMID:33278951, DOI:10.1016/j.carbpol.2020.117285

References

Additional References and Analytical Methods

Structural biology, receptor recognition and complementary low-MW characterization

Structure and receptor recognition

1. Manabe N, Yamaguchi Y. 3D Structural Insights into β-Glucans and Their Binding Proteins. Int J Mol Sci. 2021;22:1578. DOI:10.3390/ijms22041578.2. Palma AS et al. Ligands for the β-glucan receptor, Dectin-1, assigned using designer microarrays. J Biol Chem. 2006;281:5771–5779.3. Hanashima S et al. NMR study of short β(1–3)-glucans provides insights into the structure and interaction with Dectin-1. Glycoconj J. 2014;31:199–207.4. Adams EL et al. Differential high-affinity interaction of Dectin-1 with natural or synthetic glucans. J Pharmacol Exp Ther. 2008;325:115–123.

Analytical characterization: GPC and MALDI-TOF

5. Schilan3000 GPC molecular-weight data, 2021-09-28, Waters RI; Mn 1777 Da, Mw 2420 Da.6. Test report XBD-CS-2021120581, sample “Glucan degradation product A,” MALDI-7090, 2022-01-07.7. Botaride Sclero3000P comprehensive materials, pp. 9–11, technical data on low-MW β-glucan.

GPC provides molecular-weight distributions and statistical averages. MALDI-TOF resolves oligosaccharide ion series. Combining them supports robust low-MW characterization and specification development.

Complementary GPC and MALDI-TOF characterization supports low-MW SPG specification design.

Summary

PuriActives® SPG: Two Grades, Multiple Applications

Triple-helix rheology, low-MW flexibility and evidence for skincare and oral care

High-MW SPG provides triple-helical structure and rheological properties, while low-MW SPG offers chain-length flexibility. Evidence on antioxidant activity, cell protection, tissue repair and oral care supports product development across applications.

Structure and rheology1. Kuttel et al. Explicit-Solvent Molecular Dynamics Simulations of the Polysaccharide Schizophyllan in Water. Biophys J, 2007. PMC1896245.2. Kumar & Singhal. Rheological properties of schizophyllan. Am J Food Technol, 2011. DOI: 10.3923/ajft.2011.781.789.3. Fang & Nishinari. Gelation of schizophyllan/sorbitol. 2004. DOI: 10.1002/bip.10514.4. Fang et al. Rheology of denatured–renatured SPG. 2004. PMID: 15211499.5. Zhong et al. 2013. DOI: 10.1016/j.ijbiomac.2013.08.015.6. Jamshidian et al. 2017. DOI: 10.1016/j.ijbiomac.2017.06.110.

Care applications7. Gou et al. NTU-1 fermentation, UVB and melanin studies. Int J Biol Macromol, 2023. DOI: 10.1016/j.ijbiomac.2023.124504.8. He et al. Degraded SPG: antioxidant, cells and zebrafish. Front Pharmacol, 2025. DOI: 10.3389/fphar.2025.1562839.9. Lei et al. Non-homopolymeric SPG in wound healing. 2025. DOI: 10.1016/j.ijbiomac.2025.145816; CN119874951B.10. Mala et al. HGF proliferation and migration. M Dent J, 2017.11. Thongsiri et al. SPG/Dectin-1 and IL-10. 2021. DOI: 10.1016/j.carbpol.2020.117285.12. “Evaluation of the Moisturizing Efficacy of Schizophyllan” [Chinese title translated]. Journal of Chinese Institute of Food Science and Technology, 2015, 15:223–228 (bibliographic information only).

High MW: Structure and texture. Low MW: Formulation flexibility. Evidence: Skincare and oral-care innovation.

See the preceding reference section for structure, receptor and molecular-weight characterization. Original paper figures include He 2025, Kumar 2011 and Mala 2017.
PuriActives® BioAzelaic

Product positioning

Skin and scalp care applications

Azelaic acid informs development for skin tone, blemish-prone skin, and redness, with preclinical leads for scalp applications.

01 · Even skin tone and post-acne marks

Pigment-related enzyme mechanisms and randomized studies of melasma and post-inflammatory hyperpigmentation.

02 · Blemish-prone skin

Keratinization, microbial, and inflammatory mechanisms, supported by vehicle-controlled clinical evidence.

03 · Redness and skin comfort

KLK5/cathelicidin mechanisms and rosacea studies inform formulations that prioritize tolerability.

04 · Scalp and follicle research

5α-reductase, catalase, and Gli/Shh findings provide preclinical research leads.

43 · Randomized controlled trials included in the 2023 systematic review

20 rosacea / 16 acne / 7 melasma trials

[1] Todea et al., Polymers, 2021, DOI 10.3390/polym13234091 • [2] King et al., J Cosmet Dermatol, 2023, DOI 10.1111/jocd.15923

PuriPharm Co. Ltd.

Ingredient identity and biotechnology

Azelaic acid ingredient profile

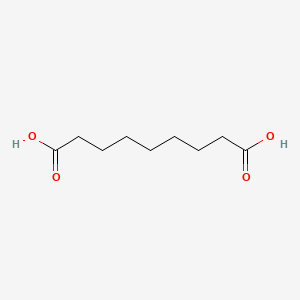
Azelaic acid is a saturated nine-carbon dicarboxylic acid.

Original 2D chemical structure / PubChem CID 2266

Property
Ingredient information
INCI
Azelaic Acid
IUPAC name
Nonanedioic acid
Molecular formula
C₉H₁₆O₄
Molecular weight
188.22 g/mol

Salts and derivatives require separate assessment of identity, solubility, and efficacy. Their data are not directly interchangeable with azelaic acid data.

[13] PubChem CID 2266, Azelaic Acid • Structure source: PubChem 2D conformer

PuriPharm Co. Ltd.

Ingredient identity and biotechnology

Biotechnological production

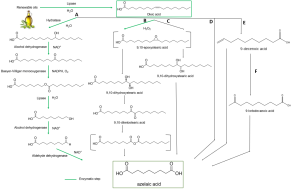
PuriActives® BioAzelaic is azelaic acid produced by a biotechnological process.

Published research includes enzymatic and chemoenzymatic conversion of oleic-acid-derived intermediates. Production origin alone does not establish biological efficacy.

Published literature routes, rather than PuriPharm’s proprietary production process.

Published azelaic acid production routes; green arrows indicate enzymatic steps

[1] Todea et al., Polymers, 2021, DOI 10.3390/polym13234091 • Original Figure 1.

The original scheme retains routes A–F, enzyme names, intermediates, chemical structures, and cofactors H₂O, H₂O₂, NAD⁺, NADPH, and O₂. Green arrows identify enzymatic steps.

PuriPharm Co. Ltd.

Scientific basis

Mechanisms relevant to skin care

Azelaic acid: multiple biological pathways

Pigment-related enzymes: tyrosinase and thioredoxin reductase

Keratinization: follicular and epidermal surface biology

Microbial activity: in vitro effects depend on concentration and pH

Inflammatory signaling: PPARγ, NF-κB, and reactive oxygen species

Innate immunity: KLK5, cathelicidin, and serine protease activity

Finished-product claims require efficacy evidence for the relevant formulation.

[3] Schallreuter and Wood, 1990, PMID 2114832 • [5] Blaskovich et al., 2019, DOI 10.1038/s41598-019-50746-4 • [6] Coda et al., 2013, PMID 23871720 • [12] Feng et al., 2024, DOI 10.2147/CCID.S485237

PuriPharm Co. Ltd.

Skin care evidence / Even skin tone

Pigment-related enzyme targets

Research reports that azelaic acid acts on tyrosinase and thioredoxin reductase.

Targets

Melanin production

Tyrosinase regulates melanin synthesis. Ki describes the interaction in an isolated-enzyme assay.

2.73 × 10⁻³ M

Ki for competitive inhibition of tyrosinase

Epidermal redox biology

Thioredoxin reductase participates in epidermal redox processes. Visible skin tone and pigmentation benefits still require product evaluation.

1.25 × 10⁻⁵ M

Ki for inhibition of membrane-associated thioredoxin reductase

Enzyme inhibition constants do not directly demonstrate finished-product efficacy.

[3] Schallreuter and Wood, Arch Dermatol Res, 1990, DOI 10.1007/BF00372617; PMID 2114832

PuriPharm Co. Ltd.

Skin care evidence / Even skin tone

Clinical research in melasma

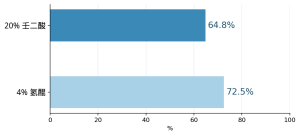
Seven randomized studies found that 20% azelaic acid outperformed vehicle for melasma severity and overall assessment.

Proportion with good/excellent improvement in one 24-week study

Treatment
Good/excellent improvement
20% azelaic acid
64.8%
4% hydroquinone
72.5%

Comparisons with 4% hydroquinone did not show a consistent significant difference. Interpret findings in the context of vehicle, duration, and outcome definitions.

Results from a single controlled study. The systematic review found no consistent advantage of either treatment.

[2] King et al., J Cosmet Dermatol, 2023, DOI 10.1111/jocd.15923 • Systematic review including 7 melasma RCTs.

PuriPharm Co. Ltd.

Skin care evidence / Even skin tone

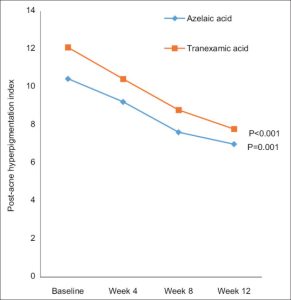
A 12-week randomized study shows improvement in post-acne hyperpigmentation

60 participants / 20% azelaic acid cream / Twice daily / 12 weeks

10.47 → 7.00

Within-group time effect: P < 0.001

Mean PAHI in the azelaic acid group: baseline to week 12

Post-acne hyperpigmentation index over time

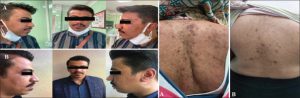
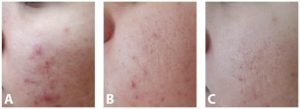
Representative azelaic acid participant photographs before and after treatment

[4] Sobhan et al., J Res Med Sci, 2023, DOI 10.4103/jrms.jrms_443_22 • Original Figures 2 and 3.

Figure key: PAHI = post-acne hyperpigmentation index. The original azelaic acid and tranexamic acid curves and statistical annotations are retained.

PuriPharm Co. Ltd.

Skin care evidence / Blemish-prone skin

Mechanisms relevant to blemish-prone skin

01 · Keratinization

Modulation of keratinocyte differentiation informs research on comedones and skin surface condition.

02 · Microbial environment

In vitro activity requires relatively high concentrations and varies with assay conditions and pH.

03 · Inflammatory signaling

Reactive oxygen species and inflammatory mediators are relevant targets in blemish-prone skin and redness research.

In vitro broth microdilution assay

8,000–16,000 µg/mL / Representative azelaic acid MIC

In vitro antibacterial activity is weaker than that of antibiotics. Reported activity was greater at pH 5.6 than at pH 7.0.

Evaluate microbial activity and cosmetic performance at the intended pH and under actual use conditions.

[5] Blaskovich et al., Sci Rep, 2019, DOI 10.1038/s41598-019-50746-4 • [12] Feng et al., 2024, DOI 10.2147/CCID.S485237

PuriPharm Co. Ltd.

Skin care evidence / Blemish-prone skin

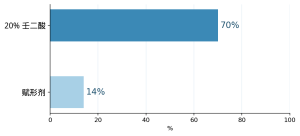
Comedone reduction in controlled studies

Four of 5 randomized studies reporting comedone outcomes found a clear difference between azelaic acid and vehicle.

Mean comedone reduction

Treatment
Mean comedone reduction
20% azelaic acid
70%
Vehicle
14%

Good/excellent overall improvement: 20% azelaic acid versus oral tetracycline, RR 0.97 [0.89–1.05], n = 594

[2] King et al., J Cosmet Dermatol, 2023, DOI 10.1111/jocd.15923 • Comedone analysis and original Figure 7.

The forest plot retains events, sample sizes, weights, random-effects risk ratios, and 95% CIs. Left favors tetracycline; right favors azelaic acid.

PuriPharm Co. Ltd.

Skin care evidence / Redness and comfort

Innate immunity and redness

Research target
Description
KLK5
Kallikrein 5; serine protease activity
CAMP
Cathelicidin expression
LL-37
Downstream peptide biology

Formulation evaluation

Visible redness, comfort, and tolerability require evaluation of the finished formula.

In a 16-week open-label study, 15% azelaic acid gel was associated with reduced KLK5/cathelicidin-related expression.

Supporting models included cultured keratinocytes and mouse skin. Serine protease activity fell significantly in the subgroup with high baseline activity.

[6] Coda et al., J Am Acad Dermatol, 2013, DOI 10.1016/j.jaad.2013.05.019; PMID 23871720

PuriPharm Co. Ltd.

Skin care evidence / Redness and comfort

Clinical findings in rosacea

63% vs 48%

Inflammatory lesion reduction at 12 weeks: azelaic acid versus vehicle

−2.82

Pooled mean difference in inflammatory lesions [−3.64, −2.00]

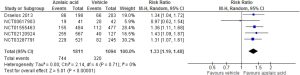
RR 1.33

Treatment success with 15% azelaic acid [1.19–1.48]; I² = 0%

Treatment success, 5 RCTs, n = 2,905

[2] King et al., J Cosmet Dermatol, 2023, DOI 10.1111/jocd.15923 • Original Figure 6 and pooled lesion analysis.

The forest plot retains all five trials and the pooled result. Left favors vehicle; right favors azelaic acid.

PuriPharm Co. Ltd.

Skin care evidence / Redness and comfort

Tolerability and formulation design

Application reactions in clinical studies

Early use may cause itching, burning, or stinging. Dryness and erythema can affect comfort during repeated use. In the PAHI study, early erythema and burning were reported more often in the azelaic acid group.

Formulation priorities

Screen vehicle, pH, and physical form together. Assess stinging, dryness, and after-feel during early and repeated use. Address both barrier support and comfort.

[2] King et al., 2023, DOI 10.1111/jocd.15923 • [4] Sobhan et al., 2023, DOI 10.4103/jrms.jrms_443_22

PuriPharm Co. Ltd.

Scalp and hair research

In vitro inhibition of 5α-reductase

An in vitro human skin study found concentration-dependent inhibition of 5α-reductase activity by azelaic acid.

Experimental system

In vitro human skin preparation; 1,2-[³H]-testosterone substrate; 5α-reductase activity outcome; azelaic acid concentration series.

0.2 mmol/L

Concentration at which inhibition was detectable

3 mmol/L

Concentration producing complete inhibition in the assay

Application validation

In vitro enzyme inhibition does not establish hair-growth or anti-hair-loss efficacy in humans.

Validate follicular models before assessing predefined human scalp outcomes.

[8] Stamatiadis et al., Br J Dermatol, 1988, DOI 10.1111/j.1365-2133.1988.tb03474.x; PMID 3207614

PuriPharm Co. Ltd.

Scalp and hair research

Catalase responses in follicular cells

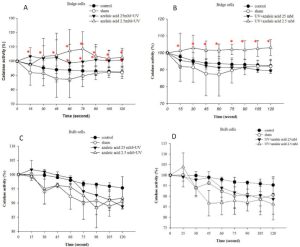
The catalase response to azelaic acid was cell-type-specific in mouse follicular cells.

A: bulge cells; B: bulge cells; C: bulb cells; D: bulb cells

Bulge cells: significantly higher catalase activity. Bulb cells: no significant change. Azelaic acid 2.5 or 25 mM; UVB 20 mJ/cm². Mouse vibrissa follicular cell system.

Preclinical findings do not directly establish cosmetic efficacy in humans.

Catalase activity in follicle-derived cells / Original Figure 1.

[7] Amirfakhryan et al., Avicenna J Phytomed, 2020;10:460–471; PMID 32995324 • Original Figure 1.

Original axes: catalase activity (%) and time (seconds). Control, UVB, azelaic acid concentrations, combined conditions, error bars, and statistical annotations are retained.

PuriPharm Co. Ltd.

Scalp and hair research

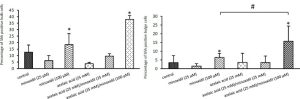
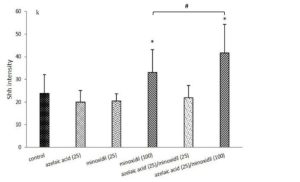
Gli and Shh responses in follicular models

Azelaic acid upregulated Gli transcripts, while the Shh protein response depended on the presence of minoxidil.

194.81-fold

Gli1 mRNA after 25 mM azelaic acid

10.82-fold

Gli2 mRNA after 25 mM azelaic acid

Single-agent transcription findings / Mouse follicle-derived cells

Shh-positive bulb and bulge cells / Quantification panels from original Figure 2.

Shh intensity in follicular organ culture / Quantification panel from original Figure 3.

[7] Amirfakhryan et al., 2020, PMID 32995324 • Quantification panels from original Figures 2 and 3.

The original concentration labels, single and combination treatments, Shh-positive cell percentages, Shh intensity, and statistical symbols are retained.

PuriPharm Co. Ltd.

Scalp and hair research

Scalp product development and validation

Development question
Targeted measurements
Role of current evidence
Scalp comfort and appearance
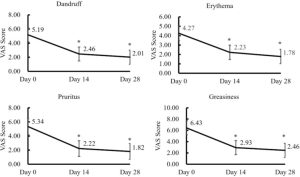
Grading of itching, visible redness, greasiness, and dandruff
Define human cosmetic evaluation outcomes
Follicular delivery
Ex vivo deposition and release under relevant conditions
Microemulsion research informs carrier design
Follicular biology
Catalase, Gli/Shh, and androgen-related experimental systems
Generate preclinical hypotheses
Hair-fiber performance
Combing, breakage, and mechanical testing
Requires separate hair-fiber experiments

Human hair-growth claims and hair-fiber care benefits require separate, targeted validation.

[7] Amirfakhryan et al., 2020, PMID 32995324 • [11] Salimi et al., 2020, DOI 10.34172/apb.2020.028

PuriPharm Co. Ltd.

Formulation science

Solubility and physical form

4.5 / 5.3

Reported pKa values for the two carboxyl groups

≈0.24% w/w

Upper water-solubility value reported in the patent background

Two formulation routes

Dissolved systems

Screen glycol–water ratios, ionization, and recrystallization risk at the target pH and over the intended storage range.

Solid dispersions

Control particle size, sedimentation, redispersibility, grittiness, and release. Confirm that the rheology stabilizes the chosen physical form.

Ionization, solvent composition, and solid-state behavior affect delivery and user experience.

After selecting a dissolved or dispersed system, optimize rheology, sensory properties, and packaging.

[9] US5925679, 1999 • [12] Feng et al., 2024, DOI 10.2147/CCID.S485237 • [14] Li et al., 2012, PMID 22111946

PuriPharm Co. Ltd.

Formulation science

Glycol–water ratios for solubilization

Glycol system
Glycol
Water
AzA
Propylene glycol
45%
40%
1.10%
Dipropylene glycol
30%
45%
1.10%
Butylene glycol
35%
45%
1.10%
PEG-32
30%
40%
1.10%
Ethoxydiglycol
25%
50%
1.10%
Hexylene glycol
20%
45%
1.10%

Formulation priorities

Solubilizing capacity varies among glycols. Adding water may lower azelaic acid solubility in these systems. Screen glycol–water ratios experimentally.

Map solubility and verify recrystallization risk and storage stability.

Selected patent combinations, each containing 1.10% azelaic acid / Data from Table 1.

[9] US5925679, Topical vehicles containing solubilized and stabilized azelaic acid, 1999 • Data from Table 1.

PuriPharm Co. Ltd.

Formulation science

Controlled clinical study of a nanocrystal hydrogel

In an 8-week randomized study, one specific 10% azelaic acid nanocrystal hydrogel had similar efficacy to a 20% cream.

Lesion reduction at week 8

Lesions
10% nanocrystal gel
20% cream
Inflammatory lesions
39.15%
33.76%
Non-inflammatory lesions
34.58%
27.96%

39.15% vs 33.76%

10% nanocrystal gel / 20% cream

34.58% vs 27.96%

Both groups improved over time, p < 0.001; efficacy was similar between groups.

10% azelaic acid nanocrystal hydrogel: baseline, week 4, and week 8 / Original Figure 3.

[10] Tomić et al., Pharmaceutics, 2021, DOI 10.3390/pharmaceutics13040567 • Original Figure 3.

PuriPharm Co. Ltd.

Formulation science

Microemulsions and follicular delivery

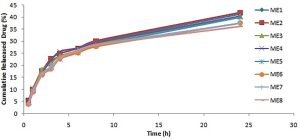
48–151 nm

Droplet-size range across 8 systems

36–42%

Cumulative release at 24 hours

Ex vivo guinea pig skin: all 8 microemulsions increased flux relative to an aqueous solution.

Cumulative release from 8 microemulsions containing 1% azelaic acid / Original release plot.

Carrier composition affects azelaic acid release and skin transport.

[11] Salimi et al., Adv Pharm Bull, 2020, DOI 10.34172/apb.2020.028 • Original release plot.

PuriPharm Co. Ltd.

Product application concepts

Product application options

Product concept
Format
Ingredient rationale
Development priorities
Tone-evening serum
Dissolved or finely dispersed serum
Skin tone and post-acne mark research
Recrystallization, color uniformity, and visible skin tone outcomes
Clear-skin gel cream
Low-grit gel cream or lotion
Keratinization and blemish-prone skin
Particle control, early comfort, and lesion appearance
Redness-soothing lotion
Barrier-supporting leave-on lotion
Innate immunity and redness research
Stinging, dryness, visible redness, and repeat-use tolerability
Leave-on scalp serum
Lightweight emulsion or delivery-focused liquid
Follicular biology and scalp care
Deposition, residue, greasiness, dandruff, and comfort

[2], [4], [6]–[12] • Each formula requires stability, compatibility, and efficacy validation.

PuriPharm Co. Ltd.

References

References and technical sources

[1] Todea A et al. Azelaic Acid: A Bio-Based Building Block for Biodegradable Polymers. Polymers. 2021;13:4091. doi:10.3390/polym13234091

[2] King S et al. A systematic review to evaluate the efficacy of azelaic acid in the management of acne, rosacea, melasma and skin aging. J Cosmet Dermatol. 2023;22:2650–2662. doi:10.1111/jocd.15923

[3] Schallreuter KU, Wood JM. A possible mechanism of action for azelaic acid in the human epidermis. Arch Dermatol Res. 1990;282:168–171. doi:10.1007/BF00372617

[4] Sobhan M et al. A comparative study of 20% azelaic acid cream versus 5% tranexamic acid solution for postinflammatory hyperpigmentation. J Res Med Sci. 2023;28:18. doi:10.4103/jrms.jrms_443_22

[5] Blaskovich MAT et al. In vitro Antimicrobial Activity of Acne Drugs Against Skin-Associated Bacteria. Sci Rep. 2019;9:14658. doi:10.1038/s41598-019-50746-4

[6] Coda AB et al. Cathelicidin, kallikrein 5, and serine protease activity is inhibited during treatment of rosacea with azelaic acid 15% gel. J Am Acad Dermatol. 2013;69:570–577. doi:10.1016/j.jaad.2013.05.019

[7] Amirfakhryan E et al. Azelaic acid stimulates catalase activation and promotes hair growth through upregulation of Gli1 and Gli2 mRNA and Shh protein. Avicenna J Phytomed. 2020;10:460–471. PMID:32995324

[8] Stamatiadis D et al. Inhibition of 5 alpha-reductase activity in human skin by zinc and azelaic acid. Br J Dermatol. 1988;119:627–632. doi:10.1111/j.1365-2133.1988.tb03474.x

[9] Mather K, Stahl CR. Topical vehicles containing solubilized and stabilized azelaic acid. US5925679. 1999. Table 1 and specification.

[10] Tomić I et al. Efficacy and Safety of Azelaic Acid Nanocrystal-Loaded In Situ Hydrogel in the Treatment of Acne Vulgaris. Pharmaceutics. 2021;13:567. doi:10.3390/pharmaceutics13040567

[11] Salimi A et al. Development and Evaluation of Azelaic Acid-Loaded Microemulsion for Transfollicular Drug Delivery Through Guinea Pig Skin. Adv Pharm Bull. 2020;10:239–246. doi:10.34172/apb.2020.028

[12] Feng X et al. Azelaic Acid: Mechanisms of Action and Clinical Applications. Clin Cosmet Investig Dermatol. 2024. doi:10.2147/CCID.S485237

[13] PubChem. Azelaic Acid, CID 2266. Molecular formula, molecular weight, IUPAC name and 2D chemical structure. National Library of Medicine.

[14] Li N et al. Effect of ionization and vehicle on skin absorption and penetration of azelaic acid. Drug Dev Ind Pharm. 2012. doi:10.3109/03639045.2011.635376

PuriPharm Co. Ltd.

PuriActives® 生物智造视黄醛

Active ingredient science / 2026

PuriActives® BioRetinal

BioRetinal / INCI: RETINAL

Biotechnologically produced retinaldehyde: one metabolic step from retinoic acid

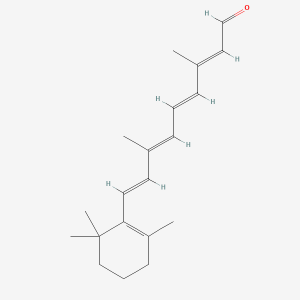
Retinaldehyde

C₂₀H₂₈O · 284.4 g/mol; the direct precursor of retinoic acid

Scientific and technical product information: skin, scalp, and formulation

Chemical structure source: PubChem CID 638015

PuriPharm Co. Ltd.

Product positioning

A defined retinoid identity for formulation innovation

PuriActives® BioRetinal combines biotechnological production with published research on topical retinaldehyde.

01

Product identity

PuriActives® BioRetinal

One enzymatic step to retinoic acid

INCI: Retinal · C₂₀H₂₈O · 284.4 g/mol

Retinaldehyde is immediately upstream of retinoic acid in cutaneous vitamin A metabolism, with a defined retinoid identity and direct topical research.

[16] PubChem, Retinal CID 638015 · [1] Zasada & Budzisz, 2019

PuriPharm Co. Ltd.

Evidence framework

One molecule connects complementary lines of research

Direct retinaldehyde studies underpin the skin care evidence; related studies inform delivery and follicle biology.

Direct retinaldehyde evidence

Topical retinaldehyde studies

Human studies assess wrinkles, texture, hydration, pigmentation, and tolerability. In vitro and human microbiology studies also inform blemish-prone skin care.

Related research

Mechanistic and application research

RA/tretinoin studies help explain follicular responses; PRN and RSC studies explore stabilization and delivery.

Human studies: 0.05% and 0.1% topical formulas. In vitro studies: Propionibacterium acnes susceptibility. Delivery studies: niosomes and proretinal systems.

Every result applies to its tested retinoid, carrier, model, and regimen.

[3] Mukherjee et al., 2006 · [12] Everts, 2012

PuriPharm Co. Ltd.

Scientific basis

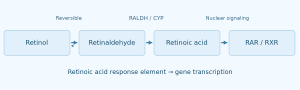
Retinaldehyde is one enzymatic step from an active retinoid ligand

Cutaneous metabolism connects precursor identity with RAR/RXR-mediated gene transcription.

Preclinical validation

Topical 0.05% retinaldehyde increased tissue RA in mouse tail skin and produced retinoid biological responses. [2]

This metabolic position distinguishes retinaldehyde from retinol and retinoic acid. It does not justify exchanging efficacy conclusions or claiming a marketing potency multiplier.

[1] Zasada & Budzisz, 2019 · [2] Didierjean et al., 1996

PuriPharm Co. Ltd.

Scientific basis

From nuclear signaling to measurable skin outcomes

Mechanistic research provides biological context; human studies assess efficacy.

Mechanistic context

RAR / RXR activation

↓

Keratinocyte differentiation and epidermal renewal

↓

Extracellular matrix homeostasis

Mechanistic value requires validation in a defined formula using appropriate measurements.

[1] Zasada & Budzisz, 2019 · [3] Mukherjee et al., 2006

PuriPharm Co. Ltd.

Skin evidence

Topical retinaldehyde research spans more than two decades

Different study designs and formulas provide multidimensional evidence for skin care development.

1998

0.05% RAL, RA, and vehicle comparison

Profilometric assessment of wrinkles and roughness; follow-up to 44 weeks [4]

1999

0.05% RAL, 2 weeks

Significant reduction in viable P. acnes [5]

2018

40 women, 3 months

Texture, TEWL, hydration, and melanin index [6]

2024

32 women, 8 weeks

0.1% retinaldehyde combination serum, 3 nights per week [8]

2025

27 participants, 6 weeks

Anhydrous 0.1% retinaldehyde combination concentrate [9]

2026

56 women, 24 weeks

Blinded split-face study of two RAL formulas [10]

[4] Creidi 1998 · [6] Kwon 2018 · [9] Åkerström 2025 · [10] Deda 2026

PuriPharm Co. Ltd.

Skin evidence / Wrinkles

Different retinaldehyde formulas show visible wrinkle improvement

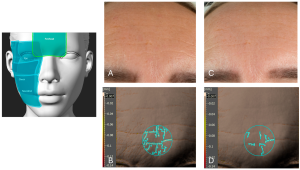
Instrumental studies link short-term imaging with longer-term wrinkle profiling.

−14%

Fine-line improvement at week 6

Cohort median; p<0.0001 [9]

12-week split-face study

Length −71.1%; area −79.9%; volume −81.25%

Median changes on the left forehead treated with the 0.1% RAL formula; respective p values: 0.018, 0.009, and 0.008. Different combination formulas were used on the two sides. [10]

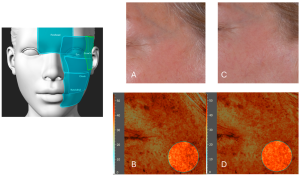
Representative forehead region at baseline and week 6, with corresponding 3D analysis. Original Figure 9; anhydrous 0.1% retinaldehyde combination formula. [9]

The image shows a representative region; its change is not the cohort median.

[9] Åkerström et al., 2025, Figs 2 & 9 · [10] Deda et al., 2026

PuriPharm Co. Ltd.

Skin evidence / Firmness

Biomechanical and ultrasound measures expand the aging-skin evidence

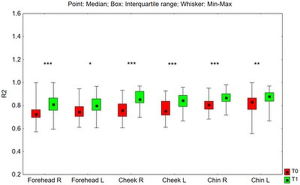
In a split-face retinaldehyde study, Cutometer R2 increased in multiple facial regions after 24 weeks.

24 weeks

R2 / Overall elasticity

R2 increased significantly in forehead, cheek, and chin regions after 24 weeks (N=52).

High-frequency ultrasound also showed increased dermal density in the assessed regions.

Original Figure 12. T0 = baseline, T1 = week 24; different retinaldehyde combination formulas were used on the two sides. [10]

[10] Deda et al., 2026, Fig 12

Figure key: point = median; box = interquartile range; whiskers = minimum–maximum; R/L = right/left.

PuriPharm Co. Ltd.

Skin evidence / Texture and barrier

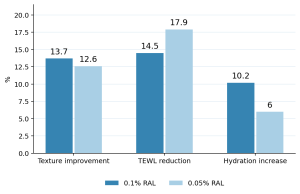
Both study concentrations improve texture, hydration, and TEWL

A randomized double-blind study compared 0.1% and 0.05% retinaldehyde creams over three months.

Change from baseline after 3 months (%)

Measure
0.1% RAL
0.05% RAL
Texture improvement
13.7%
12.6%
TEWL reduction
14.5%
17.9%
Hydration increase
10.2%
6.0%

Data from Kwon et al. [6]. Overall photoaging improvement was reported in 95% of both groups. There was no vehicle group, and between-concentration differences in the measures above were not significant.

+12%

Texture improvement at week 6 in a separate study of an anhydrous 0.1% retinaldehyde combination formula [9]

[6] Kwon et al., 2018 · [9] Åkerström et al., 2025, Fig 4

PuriPharm Co. Ltd.

Skin evidence / Skin tone

Retinaldehyde formulas show measurable pigmentation improvement

Melanin index and imaging findings are complementary across three independent clinical studies.

−12%

Pigmentation improvement at week 6

Cohort median; p<0.0001 [9]

19%

Improvement in visible pigmentation

0.1% retinaldehyde + peptides/ceramides/lipids; 8 weeks [8]

6.5%

Melanin index improvement after 3 months in the 0.1% RAL group [6]

Representative pigmentation analysis at baseline and week 6. Original Figure 11; anhydrous 0.1% retinaldehyde combination formula. [9]

The image shows a representative regional change, presented separately from the cohort median.

[6] Kwon 2018 · [8] Konisky 2024 · [9] Åkerström 2025, Fig 11

PuriPharm Co. Ltd.

Skin evidence / Blemish-prone skin

Antibacterial and comedonal-care findings broaden potential applications

Direct P. acnes susceptibility testing complements a four-week study of retinaldehyde-loaded niosomes.

Minimum inhibitory concentration

P. acnes strain
RAL MIC
RA MIC
CIP179
4 mg/L
>128 mg/L
CIP53119
4 mg/L
>128 mg/L
CIP53117
8 mg/L
>128 mg/L

Daily 0.05% retinaldehyde significantly reduced viable P. acnes after 2 weeks; the vehicle did not. MIC is a microbiological measure, not a formulation use level. [5]

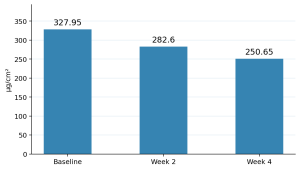
Sebum level (μg/cm²)

Time
Sebum (μg/cm²)
Baseline
327.95
Week 2
282.6
Week 4
250.65

0.05% retinaldehyde-loaded niosomal nanoemulsion, used daily for 4 weeks; n=23; p<0.05. Findings apply to the niosomal system studied. [7]

[5] Pechère et al., 1999 · [7] Kim et al., 2021

PuriPharm Co. Ltd.

Skin evidence / Tolerability

Favorable tolerability supports regular, sustained use

Evidence includes a 44-week controlled trial, recent clinical formulas, and instrumental erythema assessment.

44 weeks

0.05% retinaldehyde was well tolerated; retinoic acid caused more local irritation and affected adherence. [4]

1 / 56

One participant reported skin irritation in the 24-week split-face retinaldehyde study. [10]

Patch testing

The tested 0.1% retinaldehyde combination serum showed no evidence of irritation or sensitization. [8]

p = 0.6664

Objective erythema did not change significantly at week 6 in the anhydrous 0.1% retinaldehyde study; mild adverse events were reported. [9]

Tolerability remains formula- and regimen-dependent. Several recent studies gradually increased application frequency.

[4] Creidi 1998 · [8] Konisky 2024 · [9] Åkerström 2025 · [10] Deda 2026

PuriPharm Co. Ltd.

Formulation science / Stability

The polyene structure makes stabilization a formulation priority

Covalent proretinal research quantifies the effects of light, oxygen, and carrier design.

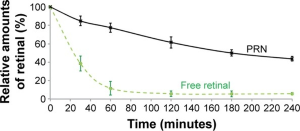
40°C + sunlight + air

1 vs 0.2

Relative degradation rate during the first hour: free retinaldehyde versus proretinal nanoparticles (PRN).

8 months / 25°C / protected from light

Free retinaldehyde: >90% degradation

PRN: <10% retinoid loss

Original Figure 3. PRN is a research chitosan–retinaldehyde system. Free retinaldehyde was solubilized in ethanol. These findings are not BioRetinal stability specifications. [11]

[11] Pisetpackdeekul et al., 2016, Fig 3

Original axes: relative retinal amount (%) and time (minutes); PRN = proretinal nanoparticles.

PuriPharm Co. Ltd.

Formulation science / Delivery

Controlled release connects stability with skin performance

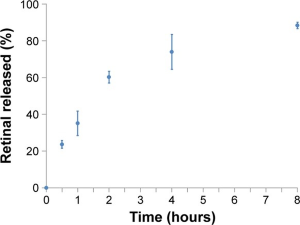
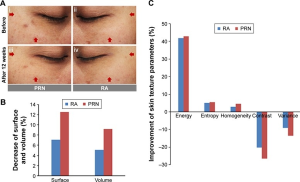
PRN illustrates sustained release from a covalent carrier at skin-relevant pH and changes in topical outcomes.

Release into artificial sebum

Original Figure 4. PRN was tested in artificial sebum at pH 5.0 and 4°C, protected from light, with sustained release measured for 8 hours. [11]

12-week split-face comparison

Original Figure 7. PRN hydrogel versus 0.025% RA hydrogel, twice daily; n=30. Surface parameter −12.5% versus −7.1%; volume parameter −9.2% versus −5.1%. [11]

[11] Pisetpackdeekul et al., 2016, Figs 4 & 7

Figure labels include retinal released (%), time (hours), surface/volume, and texture parameters: energy, entropy, homogeneity, contrast, and variance.

PuriPharm Co. Ltd.

Formulation science / Development

Design around retention, compatibility, and delivery

The goal is to maintain retinaldehyde stability during manufacturing, storage, and consumer use.

01 · Carrier architecture

Assess solubilization, aqueous exposure, and retinaldehyde distribution in the intended format.

02 · Light and oxygen control

Assess formula and packaging exposure during processing, filling, and daily use.

03 · Compatibility and processing

Screen antioxidants, chelators, polymers, and other excipients in the actual system.

04 · Finished-formula validation

Track retinaldehyde content, degradation profile, appearance, and performance over time.

Evidence to establish

Retinaldehyde content; degradation products; packaging compatibility; microbiological quality; scalp/skin tolerability; application performance.

Potential formats: night serums, creams, and leave-on scalp concepts.

[9] Åkerström et al., 2025 · [11] Pisetpackdeekul et al., 2016

PuriPharm Co. Ltd.

Chapter 02 / Scalp and follicle science

A biologically grounded direction for scalp innovation

Retinoid metabolism participates in follicle biology. The opportunity requires rigorous translation, rather than borrowing hair-growth claims from other retinoids.

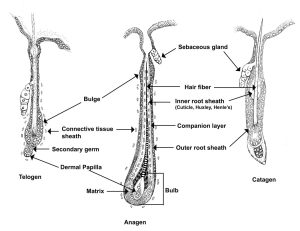
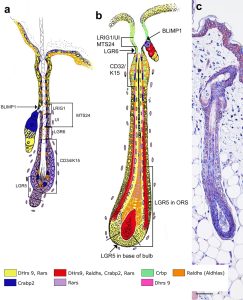
Follicular structure across the hair cycle. Original Figure 2, Everts 2012. [12]

Current evidence has not established hair-growth efficacy for BioRetinal.

Hair-cycle labels: telogen, anagen, and catagen. Anatomical labels include sebaceous gland, bulge, hair fiber, inner root sheath (cuticle, Huxley’s and Henle’s layers), companion layer, outer root sheath, connective tissue sheath, secondary germ, dermal papilla, matrix, and bulb.

PuriPharm Co. Ltd.

Scalp and follicle science

The pilosebaceous unit has its own retinoid metabolism

Retinaldehyde lies between retinol and RA in follicular signaling.

Local metabolic sequence

Retinol → Retinaldehyde → RA

DHRS9 ALDH1A1 / 2 / 3

Regulated in space and time

RA-synthesizing enzymes, binding proteins, and receptors are distributed in follicular stem-cell-associated regions, with expression patterns changing across the hair cycle.

The biological goal is homeostasis, rather than maximum retinoid exposure.

Original Figure 3. Components associated with follicular RA synthesis and reporter activity. [12]

[12] Everts, 2012, Fig 3

PuriPharm Co. Ltd.

Scalp and follicle science / Related retinoids

RA/tretinoin research informs hypotheses for follicle biology

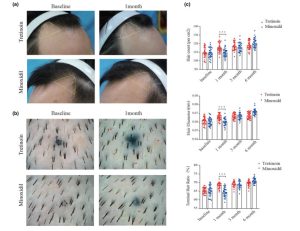
Test compound: retinoic acid/tretinoin. These results do not demonstrate retinaldehyde efficacy.

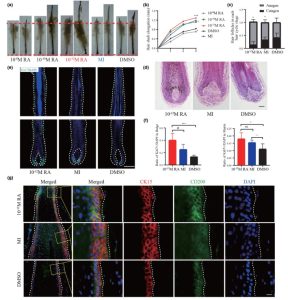
Original Figure 3. Human AGA follicle organ culture: RA concentration series, morphology, hair-cycle stage, and proliferation measures. [13]

Original Figure 6. 0.025% tretinoin versus 5% minoxidil, twice daily; 30 participants per group. [13]

[13] Wen et al., 2025, Figs 3 & 6

PuriPharm Co. Ltd.

Scalp and follicle science / Dose response

Follicular responses depend on dose, model, and retinoid

Different RA study findings support direct retinaldehyde research rather than efficacy extrapolation.

AGA follicle organ culture

10⁻¹² M RA

≈1.3× anagen proportion

In Wen’s study, hair-shaft elongation increased and anagen morphology was maintained versus DMSO. [13]

Human anagen VI scalp follicles

10⁻⁸ / 10⁻¹⁰ M ATRA

Approximately 80% catagen-like

In Foitzik’s study, approximately 30% of controls were catagen-like on day 6, and TGF-β2 was upregulated with ATRA treatment. [14]

Next evidence step: directly assess retinaldehyde scalp tolerability, exposure, and follicular responses under defined formulation conditions.

[13] Wen et al., 2025 · [14] Foitzik et al., 2005

PuriPharm Co. Ltd.

Scalp and follicle science / Delivery research

Follicular targeting provides a specific formulation research model

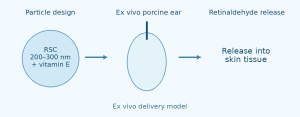
An ex vivo porcine ear study tracked retinaldehyde release from a succinyl chitosan particle system.

01 / Particle design

RSC, 200–300 nm + vitamin E

Retinaldehyde was covalently linked to succinyl chitosan, combining an imine bond, a matrix, and antioxidant protection. [15]

02 / Ex vivo skin

Porcine ear skin; follicular penetration; confocal fluorescence imaging.

03 / Retinaldehyde release

Release into skin tissue

The technical abstract reports that labeled particles entered follicles, followed by retinaldehyde release. [15]

Ex vivo delivery evidence only; it does not demonstrate hair growth in humans.

[15] Supmuang & Wanichwecharungruang, TechConnect 2012

PuriPharm Co. Ltd.

Application development

Skin care concepts focused on measurable outcomes

Each concept links consumer goals with formulation and evidence priorities.

01 · Night-time renewal

Fine lines, firmness, and long-term skin quality

Retinaldehyde retention; gradual-use regimen; imaging and Cutometer assessment.

Serum or cream

02 · Texture and skin tone

Smoothness, hydration, and visible pigmentation

Barrier support; compatibility; Antera/melanin index assessment.

Targeted leave-on care

03 · Blemish-prone skin care

Comedonal appearance and excess surface oil

Delivery selection; sebum and lesion counts; tolerability.

Lightweight leave-on formula

Development principle: validate the complete formula and regimen, beyond ingredient identity.

[5] Pechère 1999 · [6] Kwon 2018 · [9] Åkerström 2025 · [10] Deda 2026

PuriPharm Co. Ltd.

Application development / Scalp

Translate follicle biology into a rigorous scalp development plan

A leave-on scalp serum is a research concept requiring defined formulation, tolerability, and efficacy milestones.

Concept / Leave-on scalp serum

A lightweight, targeted scalp care format

Design for retinaldehyde retention, scalp comfort, and controlled deposition. Treat follicular delivery as a research variable rather than an established product feature.

Development stages

01 Formulation

Retinaldehyde content, degradation profile, packaging compatibility, and deposition.

02 Tolerability

Scalp redness, itching, dryness, and participant comfort.

03 Exploratory efficacy

Phototrichogram assessment: hair count, density, diameter, and anagen proportion.

04 Translational validation

Define the comparator, regimen, and duration before developing claims.

Initial goal: a stable, well-tolerated scalp formula for controlled efficacy research.

[12] Everts 2012 · [13] Wen 2025 · [15] Supmuang 2012

PuriPharm Co. Ltd.

Core value

BioRetinal connects ingredient identity with evidence-based development

Core value for international skin care and scalp innovation teams.

01 · Biotechnological production

A defined product feature without unsupported process or certification claims.

02 · Direct precursor of RA

Immediately upstream of retinoic acid, requiring one enzymatic conversion.

03 · Extensive skin research

Human studies address wrinkles, texture, skin tone, blemish-prone skin care, and tolerability.

04 · A rigorous innovation pathway

Formulation-first development, with scalp research grounded in follicle biology.

[1] Zasada & Budzisz 2019 · [6] Kwon 2018 · [10] Deda 2026 · [12] Everts 2012

PuriPharm Co. Ltd.

References

References / Mechanisms and skin evidence

Reference numbers match the in-text citations. Original figure numbers and study conditions appear in the adjacent captions.

[1] Zasada M, Budzisz E. Retinoids: active molecules influencing skin structure formation in cosmetic and dermatological treatments. Adv Dermatol Allergol. 2019;36:392–397. DOI: 10.5114/ada.2019.87443.

[2] Didierjean L, Carraux P, Grand D, et al. Topical retinaldehyde increases skin content of retinoic acid and exerts biologic activity in mouse skin. J Invest Dermatol. 1996;107:714–719. DOI: 10.1111/1523-1747.ep12365603. PMID: 8875955.

[3] Mukherjee S, Date A, Patravale V, Korting HC, Roeder A, Weindl G. Retinoids in the treatment of skin aging: an overview of clinical efficacy and safety. Clin Interv Aging. 2006;1:327–348. DOI: 10.2147/CIIA.2006.1.4.327.

[4] Creidi P, Vienne MP, Ochonisky S, et al. Profilometric evaluation of photodamage after topical retinaldehyde and retinoic acid treatment. J Am Acad Dermatol. 1998;39:960–965. DOI: 10.1016/S0190-9622(98)70270-1. PMID: 9843009.

[5] Pechère M, Pechère JC, Siegenthaler G, Germanier L, Saurat JH. Antibacterial activity of retinaldehyde against Propionibacterium acnes. Dermatology. 1999;199 Suppl 1:33–36. DOI: 10.1159/000051375. PMID: 10473957.

[6] Kwon HS, Lee JH, Kim GM, Bae JM. Efficacy and safety of retinaldehyde 0.1% and 0.05% creams used to treat photoaged skin: a randomized double-blind controlled trial. J Cosmet Dermatol. 2018;17:471–476. DOI: 10.1111/jocd.12551. PMID: 29663701.

[7] Kim J, Kim J, Lee YI, Suk J, Lee D, Lee JH. A pilot study evaluating the efficacy and safety of retinaldehyde-loaded niosomes against mild-to-moderate acne. J Cosmet Dermatol. 2021;20:3586–3592. DOI: 10.1111/jocd.14478. PMID: 34587353.

[8] Konisky H, Bowe WP, Yang P, Kobets K. The Clinical Efficacy and Tolerability of a Novel Retinaldehyde Serum with Firming Peptides to Improve Skin Texture and Signs of Photoaging. J Drugs Dermatol. 2024;23:992–997. DOI: 10.36849/JDD.8058R1. PMID: 39496127.

DOIs, PMIDs, and source links from the presentation are provided for verification.

PuriPharm Co. Ltd.

References

References / Formulation, scalp, and chemical identity

Reference numbers match the in-text citations. Original figure numbers and study conditions appear in the adjacent captions.

[9] Åkerström U, Gaudicheau C, Locret B, Gillbro JM. Efficacy and Safety of a Novel Anhydrous 0.1% Retinal-Based Concentrate with Hydrophilic Actives for Photoaged Skin: A Six-Week Prospective Study. Cosmetics. 2025;12:235. DOI: 10.3390/cosmetics12060235.

[10] Deda A, Odrzywołek W, Lebiedowska A, et al. Comparative Evaluation of Topical Stabilized Retinaldehyde 0.1% vs. 0.05% on Skin Biophysical and Biomechanical Parameters. Skin Res Technol. 2026;32:e70326. DOI: 10.1111/srt.70326. PMID: 41729119.

[11] Pisetpackdeekul P, Supmuang P, Pan-In P, et al. Proretinal nanoparticles: stability, release, efficacy, and irritation. Int J Nanomedicine. 2016;11:3277–3286. DOI: 10.2147/IJN.S111748. PMID: 27499622.

[12] Everts HB. Endogenous retinoids in the hair follicle and sebaceous gland. Biochim Biophys Acta. 2012;1821:222–229. DOI: 10.1016/j.bbalip.2011.08.017. PMID: 21914489.
[13] Wen L, Fan Z, Huang W, et al. Retinoic acid drives hair follicle stem cell activation via Wnt/β-catenin signalling in androgenetic alopecia. J Eur Acad Dermatol Venereol. 2025;39:189–201. DOI: 10.1111/jdv.20000. PMID: 38629345.

[14] Foitzik K, Spexard T, Nakamura M, Halsner U, Paus R. Towards dissecting the pathogenesis of retinoid-induced hair loss: all-trans retinoic acid induces premature hair follicle regression (catagen) by upregulation of TGF-β2 in the dermal papilla. J Invest Dermatol. 2005;124:1119–1126.

[15] Supmuang P, Wanichwecharungruang S. Triple protection delivery system for retinaldehyde: preparation, skin penetration and controlled release at the hair follicles. TechConnect Briefs. 2012;3:130–133. ISBN: 978-1-4665-6276-9.

[16] PubChem. Retinal, CID 638015. Molecular formula C₂₀H₂₈O; molecular weight 284.4 g/mol; official 2D chemical structure. https://pubchem.ncbi.nlm.nih.gov/compound/638015.

PuriPharm Co. Ltd. · service@puripharm.com · www.puriactives.com

DOIs, PMIDs, and source links from the presentation are provided for verification.

PuriPharm Co. Ltd.

NanoStemCell

Ingredient science / Skin care

NanoStemCell

NanoStemCell™ Botanical Liposome Complex: Skin Renewal and Anti-Aging Care

Buddleja officinalis flower extract + Salvia miltiorrhiza root extract

Huzhou Puripharm Pharmaceutical Technology Co., Ltd.

Product overview · Full set of figures · November 2026

Product overview

A two-botanical ingredient blend

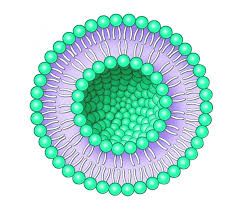
A water–polyol dispersion of botanical extracts and phospholipids for skin renewal, moisturization, and anti-aging formulations.

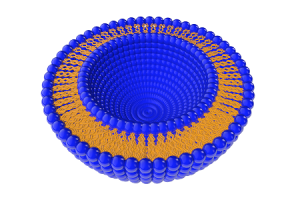
Schematic of the carrier structure. This image does not report particle-size measurements.

Recommended use level Formulation pH Processing temperature
0.1–5% 4–8 <80°C

Ingredient origins

Botanical sources

Buddleja officinalis

Flower extract

Salvia miltiorrhiza (danshen)

Root extract

Skin biology / Formulation context

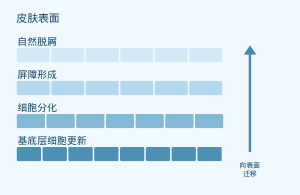
Epidermal renewal and barrier formation

Schematic of normal epidermal physiology. It does not show results from an efficacy study of NanoStemCell.

[4] Blanpain C, Fuchs E. Nat Rev Mol Cell Biol. 2009;10:207–217. doi:10.1038/nrm2636.
Product composition

Ingredients and typical proportions

INCI name Range (w/w, %) Typical proportion (w/w, %)
WATER 15–35 32.5
BUTYLENE GLYCOL 15–35 30.0
PROPYLENE GLYCOL 15–35 32.0
PHOSPHOLIPIDS 1.5–10 3.5
BUDDLEJA OFFICINALIS EXTRACT 0.5–1.5 1.0
SALVIA MILTIORRHIZA EXTRACT 0.5–1.5 1.0

The typical composition totals 100.0%. These are supplier formulation figures and do not represent measurements of a specific batch.

Source: Supplier ingredient breakdown and composition table totaling 100%.

Carrier and production process

Preparing the botanical dispersion

Phospholipids act as a carrier component in the water–polyol dispersion of botanical extracts.

Research overview

Research on the botanical ingredients

Test material Experimental model Research focus
Buddleja officinalis extract [1] UVB-exposed HaCaT keratinocytes NRF2-related oxidative stress responses
Salvianolic acid B [2] UVB-exposed human dermal fibroblasts MAPK/AP-1 and extracellular matrix markers
Salvianolic acid B [3] Dermal fibroblasts and a mouse model of photoaging NRF2, mitochondria, and cellular senescence

The studies tested research extracts or isolated compounds. They do not establish the clinical efficacy of the NanoStemCell ingredient blend.

Sources: Zhu et al., 2025 [1]; Sun et al., 2015 [2]; Sun et al., 2024 [3].

Botanical ingredient research / In vitro study

Buddleja officinalis: Cellular antioxidant pathways

Experimental system

HaCaT keratinocytes; UVB: 30 mJ/cm²

Research extract, 62.5–250 µg/mL; 2-hour pretreatment

Study measure Direction of change
Reactive oxygen species / malondialdehyde (MDA) Decreased
SOD / GSH:GSSG Increased
NRF2, HO-1, and NQO1 Stronger associated responses
Cell viability Improved

Qualitative summary. The concentrations shown apply to the extract used in this study.

[1] Zhu X, et al. Pharm Biol. 2025;63:567–581. doi:10.1080/13880209.2025.2540348.

Isolated compound research / In vitro study

Salvia miltiorrhiza: Extracellular matrix pathways

Salvianolic acid B

Purified compound, 1–100 µg/mL; UVB-exposed human dermal fibroblasts

Pathway / measure Study observation
MAPK / AP-1 signaling Reduced activation
MMP-1 and IL-6 Reduced expression
Type I procollagen and TGF-β1 Increased

[2] Sun Z, et al. Photochem Photobiol. 2015;91:879–886. doi:10.1111/php.12427.
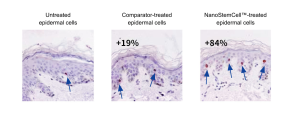
Isolated compound research / Preclinical study

Salvia miltiorrhiza: NRF2 and mitochondrial function

Salvianolic acid B

UVB-exposed dermal fibroblasts and a mouse model of photoaging

NRF2 · Activation

Mitochondria · Protection

Cellular senescence · Reduction

[3] Sun JM, et al. Phytomedicine. 2024;130:155676. doi:10.1016/j.phymed.2024.155676.
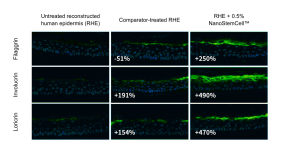
Supplier images / 01 of 08

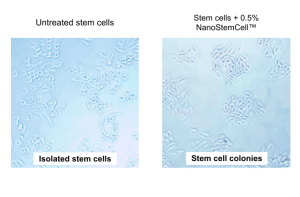
Cell colony micrographs

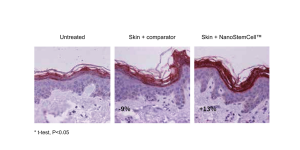
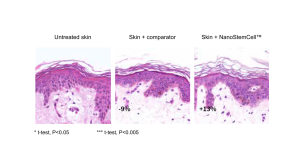
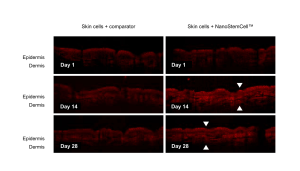
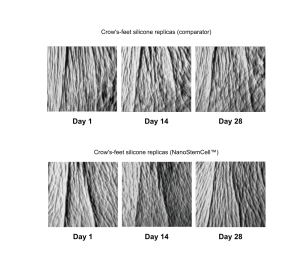
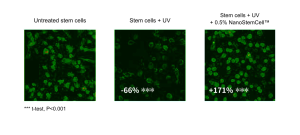
About these eight supplier images: Although the figure labels say NanoStemCell™, the presentation identifies Revivyl™ as the test material in the source Word document. Interpret the findings for the original test material; they are not measurements of NanoStemCell efficacy.

Left: untreated cells. Right: the 0.5% formulation group as labeled. The panels show isolated cells and cell colonies, respectively.

The figure labels the cells as stem cells.

Supplier images / 02 of 08

Fluorescence images of the UV response

Left to right: untreated cells, UV-exposed cells, and UV-exposed cells with the 0.5% formulation shown in the label.

Original annotations: UV group −66%***; labeled formulation + UV group +171%***. *** t-test, P < 0.001.

Supplier images / 03 of 08

Ki67 histology

Left to right: untreated skin, comparator-treated skin, and the formulation group as labeled. Arrows indicate staining features.

Original annotations: comparator +19%; labeled formulation +84%.

Supplier images / 04 of 08

Imaging of differentiation markers

Rows: filaggrin, involucrin, and loricrin. Columns: untreated reconstructed human epidermis (RHE), comparator-treated RHE, and the 0.5% formulation group as labeled.

Original annotations (comparator / labeled formulation): filaggrin −51% / +250%; involucrin +191% / +490%; loricrin +154% / +470%.

Supplier images / 05 of 08

KLK5 immunostaining

Left to right: untreated skin, comparator-treated skin, and the formulation group as labeled. The image retains the KLK5 staining and the supplier’s original numerical annotations.

Original annotations: comparator −9%; labeled formulation +13%. Figure note: * t-test, P < 0.05.

Supplier images / 06 of 08

Histology of surface desquamation

Left to right: untreated skin, comparator-treated skin, and the formulation group as labeled. Numerical annotations are retained as shown in the source.

Original annotations: comparator −9%; labeled formulation +13%. Figure notes: * t-test, P < 0.05; *** t-test, P < 0.005.

Supplier images / 07 of 08

OCT images over time

Columns: comparator and the formulation group as labeled. Rows: days 1, 14, and 28. Arrows are retained as shown in the source.

Skin layers labeled in the image: epidermis and dermis.

Supplier images / 08 of 08

Photographs of silicone replicas of crow’s feet

Top row: comparator. Bottom row: the formulation group as labeled. In each row, replicas are shown from left to right for days 1, 14, and 28.

Application development

Skin care formulation applications

01 · Daily serums

Formulations for skin conditioning and improved skin texture.

02 · Day and night creams

Facial moisturization and anti-aging formulations.

03 · Body lotions for dry skin

Lotion formats for daily face and body care.

04 · Water-based skin care mists

Aqueous formats for daily skin care.

Formulation guidance

Recommended incorporation conditions

0.1–5.0% · Of the finished formulation

Item Recommendation
Temperature Below 80°C
Formulation pH 4.0–8.0
Mixing Gentle stirring

Add near the end of processing or to the aqueous phase.

Verify compatibility, stability, and performance in the finished formulation at the intended use level.

Use-level calculations

Ingredient contributions at different use levels

Estimated component concentrations in the finished formulation (w/w, %)

NanoStemCell use level 0.1% 1.0% 3.0% 5.0%
Buddleja officinalis extract 0.001 0.010 0.030 0.050
Salvia miltiorrhiza extract 0.001 0.010 0.030 0.050
Phospholipids 0.0035 0.035 0.105 0.175
Total polyols¹ 0.062 0.620 1.860 3.100

¹ Sum of propylene glycol and butylene glycol. Calculation: ingredient use level × typical proportion of the component.

Technical information

Quality specifications and storage

Quality parameter Specification
Appearance Pale yellow to yellow liquid
Total aerobic count ≤100 CFU/g
Yeasts and molds ≤10 CFU/g
Escherichia coli / Salmonella Not detected per g

Storage temperature · 4–25°C

Shelf life in unopened original packaging · 12 months

Protect from sunlight. Use plastic containers.

Research and product materials

References and source documents

Published research

[1] Zhu X, et al. Pharm Biol. 2025;63(1):567–581.doi:10.1080/13880209.2025.2540348

[2] Sun Z, et al. Photochem Photobiol. 2015;91(4):879–886.doi:10.1111/php.12427

[3] Sun JM, et al. Phytomedicine. 2024;130:155676.doi:10.1016/j.phymed.2024.155676

[4] Blanpain C, Fuchs E. Nat Rev Mol Cell Biol. 2009;10(3):207–217.doi:10.1038/nrm2636

Product source documents

Puripharm NanoStemCell product information, revision jv2; English product materials; supplier image set (nanostemcell_pic180709); ingredient composition table; origin statement; process documents; technical data; and certificate of analysis (COA) dated December 23, 2025.

Huzhou Puripharm Pharmaceutical Technology Co., Ltd.

NanoStemCell

Botanical research to support skin care formulation development

www.puriactives.com

service@puripharm.com | +86-572-2745768

Building 6, No. 1366 Hongfeng Road, Huzhou, Zhejiang, China

NanoActive 4-TERPINEOL 20%

NanoActive 4-TERPINEOL 20%Terpinen-4-ol Nanoliposomes

Product overview

NanoActive 4-TERPINEOL 20% Terpinen-4-ol Nanoliposomes

Terpinen-4-ol science: skin, eyelid, scalp and oral care

PuriPharm Co. Ltd.

PURISOME® FlexVes™ Liposome Technology

Product and value

One defined active, four formulation-development areas

Hart et al. Inflamm Res. 2000. DOI: 10.1007/s000110050639. Tighe et al. Transl Vis Sci Technol. 2013. DOI: 10.1167/tvst.2.7.2. Francisconi et al. Braz Oral Res. 2020. DOI: 10.1590/1807-3107bor-2020.vol34.0050.

Biological evidence for the active

Terpinen-4-ol research covers inflammatory-mediator regulation, microbial inhibition and biofilm effects.

A lipid-carrier formulation strategy

PURISOME® FlexVes™ Liposome Technology provides a platform design for active encapsulation.

Skin care

Blemish-prone skin and skin comfort

Eyelid and periocular care

External cleansing and lash-root care

Scalp and hair care

Scalp cleansing and dandruff-related care

Oral care

Formulation development targeting biofilms

Product and value

Product information and commercial specification

PuriPharm Co. Ltd. PURISOME technology brand document, v1.0, July 17, 2026. PubChem CID 11230; NIST Chemistry WebBook, CAS 562-74-3.

Product information PuriPharm product
Product name NanoActive 4-TERPINEOL 20% Terpinen-4-ol Nanoliposomes
Core active INCI 4-TERPINEOL
Molecular name in the literature Terpinen-4-ol
CAS number 562-74-3
Delivery platform PURISOME® FlexVes™ Liposome Technology

20% is the designated commercial specification. The basis for measuring active content and the full ingredient INCI list must follow the official product specifications.

Product and value

A monoterpene alcohol with lipophilic properties

PubChem CID 11230; NIST Chemistry WebBook, CAS 562-74-3. Akbarzadeh et al. Nanoscale Res Lett. 2013. DOI: 10.1186/1556-276X-8-102.

A defined molecular identity

A cyclic carbon skeleton carries one hydroxyl group. Terpinen-4-ol differs from α-terpineol and other terpineol isomers.

Relevance to formulation design

The molecular structure provides a rationale for active–lipid association strategies in phospholipid delivery systems.

Biological evidence

Three categories of biological evidence support application development

Hart et al. Inflamm Res. 2000. DOI: 10.1007/s000110050639. Tighe et al. Transl Vis Sci Technol. 2013. DOI: 10.1167/tvst.2.7.2. Francisconi et al. Braz Oral Res. 2020. DOI: 10.1590/1807-3107bor-2020.vol34.0050.

Inflammatory mediators

Human monocyte and mouse macrophage studies connect terpinen-4-ol with inflammatory-mediator production and cellular signaling.

Contact-dependent activity

Bacterial, fungal and Demodex experiments show concentration and contact-time responses in specific models.

Surface-associated biofilms

Studies separately assess biofilm formation, mature biomass, metabolic activity and adhesion-related gene expression.

The test material, model and endpoint determine how a result informs formulation development.

Biological evidence

Terpinen-4-ol reduces inflammatory-mediator production

Original Figure 3A, B and E. LPS-stimulated human monocytes, cultured for 40 h.

Hart et al. Inflamm Res. 2000. DOI: 10.1007/s000110050639.

Figure labels: terpinen-4-ol; α-terpineol; 1,8-cineole; viability. Concentrations a/b and LPS conditions are specified in the text.

Terpinen-4-ol: a = 0.052%, b = 0.026% (v/v). LPS = 500 ng/mL. Three donors, triplicate wells. Mean + SEM; *P < 0.05.

Biological evidence

Inflammatory-mediator responses depend on material and exposure time

Original Table 3. Pure terpinen-4-ol and water-soluble tea tree oil components.

Hart et al. Inflamm Res. 2000. DOI: 10.1007/s000110050639.

Adherent human peripheral blood monocytes, LPS-induced. – = no significant decrease; P<0.05 for all changes shown.

Pure terpinen-4-ol

At 0.052% v/v, TNF-α, IL-1β, IL-8 and PGE₂ all decreased.

IL-10 is an anti-inflammatory cytokine, so its reduction has a different biological meaning.

Biological evidence

Reduced IL-6 and TNF-α transcription in macrophages

Original Figure 1. RAW264.7 cell viability and LPS-induced cytokine gene expression.

Liu et al. Foods. 2024. DOI: 10.3390/foods13121842.

Figure labels: cell viability; relative mRNA expression; control; T-4-O = terpinen-4-ol.

IL-6 and TNF-α vary with tested concentration

This gene-expression study adds evidence from another cell model to the human-monocyte inflammatory-mediator findings.

Biological evidence

Immunoblots show changes in mTOR and NF-κB signaling

Original Figure 7A, shown in two parts with the same lane order.

Liu et al. Foods. 2024. DOI: 10.3390/foods13121842.

Lane order: control, T-4-O, LPS, LPS + T-4-O.

Biological evidence

Lower phosphorylation ratios versus LPS alone

Original Figure 7B. RAW264.7 cells pretreated with terpinen-4-ol 100 µmol/L before LPS stimulation.

Liu et al. Foods. 2024. DOI: 10.3390/foods13121842.

mTOR, NF-κB and IκB phosphorylation ratios were lower than in the LPS group. The corresponding AMPK comparison was not significant.

Biological evidence

Lower ECAR/OCR ratio after terpinen-4-ol treatment

Original Figure 2. Terpinen-4-ol 100 µmol/L for 2 h, followed by LPS 1 µg/mL for 6 h.

Liu et al. Foods. 2024. DOI: 10.3390/foods13121842.

Figure labels: ECAR; OCR; time (min); ns. Original individual measurements and ratios retained.

An altered energy-metabolism ratio

The ECAR/OCR ratio decreased versus LPS alone. The corresponding comparisons for ECAR and OCR individually were not significant in the original figure.

Biological evidence

Selective responses of glutamine-metabolism genes

Original Figure 6. Four metabolism-related genes in RAW264.7 macrophages.

Liu et al. Foods. 2024. DOI: 10.3390/foods13121842.

Gene responses differ

Versus LPS, GLS and GDH expression increased; ASNS and GAD showed no significant change in the same comparison.

Biological evidence

A proposed mechanism linking metabolism and inflammation

Original Figure 8. A mechanistic model proposed by the authors from cell experiments.

Liu et al. Foods. 2024. DOI: 10.3390/foods13121842.

Figure labels: extracellular/cytoplasm; glutamine/glutamate; TCA cycle; OXPHOS; inflammatory cytokines.

Integrating cell-level mechanisms

Glutamine metabolism, mTOR and NF-κB are linked to inflammatory signaling. The figure presents the authors’ mechanistic interpretation of their results.

Biological evidence

Concentration-dependent bactericidal activity

Original Figure 1. Methicillin-resistant Staphylococcus aureus (MRSA) ATCC 43300; viable plate counts.

Cheng et al. BMC Microbiol. 2021. DOI: 10.1186/s12866-021-02348-2.

Figure labels: control; MIC; time (h); log10(CFU/mL).

Inhibitory and bactericidal concentrations differ

MIC: 0.16% v/v

MBC: 0.32% v/v

The authors report no recoverable viable bacteria within 2 h at 0.32%.

Biological evidence

Different responses in biofilm formation and mature biomass

Original Figure 2. Crystal violet assay, MRSA ATCC 43300.

Cheng et al. BMC Microbiol. 2021. DOI: 10.1186/s12866-021-02348-2.

Figure labels: time (h); clearance of biofilm; OD590 crystal-violet absorbance.

Formation inhibition and biomass removal are different endpoints

At 0.16% v/v: 24 h biofilm-formation inhibition was 48.09 ± 0.97%; mature-biofilm biomass removal was 93.90 ± 3.33%.

Biological evidence

Confocal imaging shows altered biofilm viability

Original Figure 3. Preformed MRSA biofilm; LIVE/DEAD staining.

Cheng et al. BMC Microbiol. 2021. DOI: 10.1186/s12866-021-02348-2.

Images show a concentration response

A: untreated

B: 0.04% v/v

C: 0.08% v/v

D: 0.16% v/v

Green: viable cells

Red: membrane-compromised cells

Biological evidence

Reduced extracellular DNA in treated biofilms

Original Figure 9. eDNA normalized to relative biofilm biomass.

Cheng et al. BMC Microbiol. 2021. DOI: 10.1186/s12866-021-02348-2.

Figure labels: ng eDNA/relative biomass; control; concentration of terpinen-4-ol.

An effect related to the biofilm matrix

At 0.16% v/v, eDNA decreased by 61.88 ± 0.58% versus control, informing research on microbial growth and biofilm structure.

Biological evidence

An animal infection model provides antifungal evidence

Original Figure 1. Candida albicans SA-40; experimental vaginal candidiasis.

Mondello et al. BMC Infect Dis. 2006. DOI: 10.1186/1471-2334-6-158.

Original treatment groups

▲ Terpinen-4-ol 1% v/v

■ Vehicle control

● Fluconazole 100 µg

□ Tea tree oil 5% v/v

○ Tea tree oil 1% v/v

△ Tea tree oil 2.5% v/v

Five rats per group. Intravaginal dosing at 1, 24 and 48 h after infection, 0.1 mL per dose. Mean ± SE.

Biological evidence

Antifungal activity also observed against an azole-resistant strain

Original Figure 2. C. albicans AIDS-68; experimental vaginal candidiasis in rats.

Mondello et al. BMC Infect Dis. 2006. DOI: 10.1186/1471-2334-6-158.

Original treatment groups

▲ Terpinen-4-ol 1% v/v

■ Vehicle control

● Fluconazole 100 µg

□ Tea tree oil 5% v/v

○ Tea tree oil 1% v/v

Five rats per group. Terpinen-4-ol 1% v/v. Administration was vaginal in this animal model.

Delivery design

PURISOME® provides a phospholipid delivery structure

PuriPharm Co. Ltd. PURISOME technology brand document, v1.0, July 17, 2026. Akbarzadeh et al. Nanoscale Res Lett. 2013. DOI: 10.1186/1556-276X-8-102.

Phospholipid bilayer

Polar heads face the internal and external aqueous phases; hydrophobic tails form the bilayer interior.

Active–lipid association

Lipid-associated actives can disperse into formulations with the vesicular system. Their distribution depends on carrier composition.

Structural schematic, not a measurement of particle size or active localization in this product.

Delivery design

Encapsulation links formulation dispersion to local contact

Akbarzadeh et al. Nanoscale Res Lett. 2013. DOI: 10.1186/1556-276X-8-102. PuriPharm Co. Ltd. PURISOME technology brand document, v1.0, July 17, 2026.

Dispersion

Dispersed carriers organize the lipophilic active, providing a design route for incorporation into aqueous formulations.

Local contact

The base, carrier and use method jointly determine contact at the target surface and the available fraction of active.

User experience

Odor, appearance, spreading and residue, alongside active retention, are measurable development variables.

Design goal: consistent surface delivery and appropriate finished-product experience.

Skin care

Clarifying care draws on microbial and inflammatory-mediator evidence

Lee et al. J Food Drug Anal. 2013. DOI: 10.1016/j.jfda.2013.05.007. Hart et al. Inflamm Res. 2000. DOI: 10.1007/s000110050639.

Blemish-prone skin

Microbial evidence

Growth-inhibition results support evaluation of clarifying formulations under actual contact conditions.

Inflammatory-mediator evidence

Human-monocyte findings support further assessment of skin comfort and visible redness in finished products.

Development focus: surface cleansing, skin appearance and perceived comfort.

Skin care

In vitro inhibition of bacteria associated with blemish-prone skin

The experiment distinguished individual components, whole tea tree oil and reconstituted mixtures.

Lee et al. J Food Drug Anal. 2013. DOI: 10.1016/j.jfda.2013.05.007.

Cutibacterium acnes

Cutibacterium acnes; the paper uses the former name Propionibacterium acnes.

Staphylococcus aureus

Staphylococcus aureus

Terpinen-4-ol inhibited both microorganisms.

Active-component selection matters

In reconstituted tea tree oil mixtures, the terpinen-4-ol proportion correlated positively with activity against C. acnes.

A defined active identity helps focus formulation development for blemish-prone skin.

Skin care

A tea tree oil gel trial provides human skin-care context

5% tea tree oil gel versus placebo; 60 participants; 45 days.

Enshaieh et al. Indian J Dermatol Venereol Leprol. 2007. DOI: 10.4103/0378-6323.30646.

Study element Reported information
Design Randomized, double-blind, placebo-controlled
Groups Tea tree oil gel: n = 30; placebo: n = 30
Assessments Total lesion count and acne severity index, assessed every 15 days
Endpoints Both improved significantly versus placebo

This human evidence applies to a gel containing whole tea tree oil.

Skin care

Skin-care concepts: translating evidence into formulation roles

Lee et al. J Food Drug Anal. 2013. DOI: 10.1016/j.jfda.2013.05.007. Hart et al. Inflamm Res. 2000. DOI: 10.1007/s000110050639.

Clarifying serum or gel

Need: localized care for blemish-prone skin. Role: incorporate a defined active and evaluate dispersion and sensory properties.

Comfort-care lotion

Need: comfortable daily care. Role: combine with an appropriate moisturizing base and measure perceived comfort.

Facial cleanser

Need: daily surface cleansing. Role: assess active availability after surfactant mixing and under actual rinsing conditions.

Eyelid and periocular care

External eyelid, lash-root and periocular care involve different sites

Fromstein et al. Clin Optom. 2018. DOI: 10.2147/OPTO.S142708. Wang et al. Transl Vis Sci Technol. 2024. DOI: 10.1167/tvst.13.11.22.

External care-area schematic and published in vivo confocal images of eyelash follicles.

Periocular skin

Cosmetic care of the skin around the eyes

External eyelid and lash roots

Original Figure 6

Demodex within follicles

Demodex can inhabit eyelash follicles. Numbers in the original image mark mite positions within the same follicle.

Development focus: external surface cleansing and controlled contact at lash roots.

Eyelid and periocular care

Terpinen-4-ol leads in a tea tree oil component comparison

Upper half of original Table 2. Adult Demodex mites; mineral-oil dilution; observation for up to 150 min.

Tighe et al. Transl Vis Sci Technol. 2013. DOI: 10.1167/tvst.2.7.2.

Survival time: mean ± SD, min; potency order as in the source. N=6 unless stated. *TTO values from Gao et al. (2005). ND and original blank areas are retained; blanks are not converted to 0 or ND.

Mean ± SD; n = 6 unless otherwise indicated. * Tea tree oil data are from Gao et al. (2005).

ND: not determined; reasons follow in the next section.

Eyelid and periocular care

Other tea tree oil constituents show different activity

Lower half of original Table 2, with column headers repeated for readability.

Tighe et al. Transl Vis Sci Technol. 2013. DOI: 10.1167/tvst.2.7.2.

Survival time: mean ± SD, min; N=6 unless stated. ND means not determined; reasons and solubility limits are explained in the original and this section. Blank and spanning blank areas retain their source positions without inferred results.

ND: not determined. Reasons include survival beyond 150 min, unavailability of δ-cadinene/globulol, or insolubility of sabinene/viridiflorol at the relevant concentration. n = 6 unless otherwise indicated.

Eyelid and periocular care

An external-cleansing case documents changes in the lid margin and mites

Original Figure 1. One patient aged 61; eyelid cleansing twice daily for 8 weeks.

Tighe et al. Transl Vis Sci Technol. 2013. DOI: 10.1167/tvst.2.7.2.

Lash-root appearance and mite counts

A–B: baseline

C–D: after 8 weeks

Mites on 8 sampled eyelashes decreased from 22 to 0. This was an uncontrolled single-case observation.

Eyelid and periocular care

Combined eyelid care sustained the reduction in mite counts

Wang et al. Transl Vis Sci Technol. 2024. DOI: 10.1167/tvst.13.11.22.

Randomized, open-label trial, n = 40. Month 3 was one month after intervention stopped.

Original Figure 2 and selected data from original Table 2.

Figure labels: total Demodex; baseline; months 1/2/3; T4O wipes; DC+T4O deep cleaning plus wipes.

Two care regimens

Both groups used terpinen-4-ol cleansing wipes twice daily for 2 months.

The combination group also received deep cleaning with 0.01% hypochlorous acid at baseline and months 1 and 2.

Mite-count change, mean ± SD Month 2
Wipes −5.65 ± 6.03
Wipes + deep cleaning −7.75 ± 6.91
Between-group P 0.312
Mite-count change, mean ± SD Month 3
Wipes −4.15 ± 6.91
Wipes + deep cleaning −8.70 ± 6.81
Between-group P 0.043

Eyelid and periocular care

Mite-count changes vary across follow-up visits

Original Figure 3. Within-group comparisons; month 3 was one month after intervention stopped.

Wang et al. Transl Vis Sci Technol. 2024. DOI: 10.1167/tvst.13.11.22.

Figure labels: T4O; DC+T4O; baseline; month; ns.

Persistence during follow-up

Counts decreased significantly at month 2 in the wipes group and at months 2 and 3 in the combination group. Comparisons are against each group’s own baseline.

Eyelid and periocular care

Between-group symptom-score differences were not significant

Original Figure 4. Ocular Surface Disease Index (OSDI).

Wang et al. Transl Vis Sci Technol. 2024. DOI: 10.1167/tvst.13.11.22.

Figure labels: Ocular Surface Disease Index; baseline; month; T4O and DC+T4O regimens.

Additional patient-reported symptom evidence

OSDI trended downward in both groups. The combination group improved significantly from baseline at months 2 and 3, but between-group differences were not statistically significant.

Eyelid and periocular care

Another wipes trial reported greater symptom improvement

Terpinen-4-ol + hyaluronate wipes versus diluted baby shampoo; 24 participants per group.

Arici et al. Eye. 2022. DOI: 10.1038/s41433-021-01642-7.

Figure labels: lid wipes; baby shampoo; baseline; weeks 4/8/12; OSDI.

Figure labels: BLISS; lid wipes; baby shampoo; original follow-up times.

Week-8 OSDI change: −9.2 ± 9.8 with wipes versus −0.8 ± 9.9 with shampoo (P = 0.024).

Eyelid and periocular care

Both care methods reduced measured mite counts

Selected and rearranged data from original Table 3. Mites per sampled eyelash; mean ± SD.

Arici et al. Eye. 2022. DOI: 10.1038/s41433-021-01642-7.

Group / comparison T4O + hyaluronate wipes
Baseline 1.52 ± 1.54
Week 4 0.07 ± 0.16
Week 8 0
Week 12 0.01 ± 0.05
Group / comparison Diluted baby shampoo
Baseline 1.21 ± 0.95
Week 4 0.17 ± 0.32
Week 8 0.01 ± 0.05
Week 12 0
Group / comparison Between-group P
Baseline 0.868
Week 4 0.415
Week 8 0.317
Week 12 0.317

Both groups declined from baseline. Between-group patterns differed for symptom improvement and mite counts.

Eyelid and periocular care

External eyelid products require controlled contact conditions

Tighe et al. Transl Vis Sci Technol. 2013. DOI: 10.1167/tvst.2.7.2. Wang et al. Transl Vis Sci Technol. 2024. DOI: 10.1167/tvst.13.11.22.

Cleansing wipes

Need: controlled lash-root cleansing. Role: define delivered amount, wetness, contact method and residue.

Cleansing foam

Need: convenient external eyelid cleansing. Role: evaluate foam performance, rinsing and migration toward the eye.

Periocular skin-care formulation

Need: comfortable care around the eyes. Role: select an appropriate base and validate repeated-use tolerance at the intended site.

Scalp and hair care

Whole tea tree oil inhibits multiple Malassezia species

Whole tea tree oil; 54 isolates from 5 species. Agar dilution; incubation at 32°C for 7 days.

Hammer et al. Antimicrob Agents Chemother. 2000. DOI: 10.1128/AAC.44.2.467-469.2000.

Malassezia species Isolates, n Tea tree oil MIC range, % v/v
M. furfur 12 0.12–0.25
M. sympodialis 32 0.016–0.25
M. slooffiae 3 0.12–0.25
M. globosa 5 0.03–0.12
M. obtusa 2 0.12

Species and culture conditions affect results. These data provide context for scalp-related activity testing in target formulations.

Scalp and hair care

Terpinen-4-ol inhibits canine Malassezia isolates

Original Table 2. M. pachydermatis from canine clinical samples and a reference strain.

Čonková et al. Vet Res Commun. 2024. DOI: 10.1007/s11259-024-10446-5.

Isolates and reference strain CBS 1879 are shown separately. x̄ = mean; SD = standard deviation; MIC prevents visible growth; MIC₅₀/MIC₉₀ inhibit 50%/90% of isolates. The source footnote states that means with the same superscript letter differ significantly (p<0.05; one-way ANOVA and Tukey’s test); its wording is retained without reinterpretation.

Direct data on the single constituent

Terpinen-4-ol MIC₅₀: 800 µg/mL

MIC₉₀: 3,130 µg/mL

The species and isolate source differ from those in human scalp Malassezia research.

Scalp and hair care

Phospholipase phenotypes change after exposure

Original Figure 2. M. pachydermatis isolates treated at each isolate’s corresponding MIC.

Čonková et al. Vet Res Commun. 2024. DOI: 10.1007/s11259-024-10446-5.

Figure legend: negative, weak, poor, moderate and intensive phospholipase activity; no growth. Exposure times: 1, 3 and 6 h.

Growth and enzyme activity require separate interpretation

The original classification distinguishes phospholipase activity from no growth. “Terpinen” in the figure denotes terpinen-4-ol.

Scalp and hair care

A shampoo trial provides evidence for dandruff-related care

5% tea tree oil shampoo, daily for 4 weeks. Randomized, single-blind, parallel-group trial, n = 126.

Satchell et al. J Am Acad Dermatol. 2002. DOI: 10.1067/mjd.2002.122734.

41% versus 11%

Improvement in the quadrant-area–severity score

P < 0.001

This composite endpoint includes both affected area and severity.

Redrawn from values in the original abstract. Percentages describe score improvement, not a reduction in dandruff particle counts.

Scalp and hair care

Scalp concepts balance cleansing, contact and comfort

Hammer et al. Antimicrob Agents Chemother. 2000. DOI: 10.1128/AAC.44.2.467-469.2000. Satchell et al. J Am Acad Dermatol. 2002. DOI: 10.1067/mjd.2002.122734. Hart et al. Inflamm Res. 2000. DOI: 10.1007/s000110050639.

Dandruff-care shampoo

Need: scalp cleansing and visible-dandruff management. Role: test activity in the surfactant system at actual in-use dilution.

Scalp cleanser

Need: removal of surface buildup. Role: combine microbial endpoints with coverage, rinsing and scalp-experience assessments.

Scalp serum

Need: localized leave-on care. Role: study residence, residue and comfort, with dedicated tolerability testing.

Oral care

Oral-cleansing research distinguishes three laboratory endpoints

Bordini et al. Biofouling. 2018. DOI: 10.1080/08927014.2018.1504926. Francisconi et al. Braz Oral Res. 2020. DOI: 10.1590/1807-3107bor-2020.vol34.0050.

01

Planktonic inhibition

Microbial growth in suspension

02

Surface-associated biofilms

Metabolic activity on material surfaces

03

Adhesion-related responses

Expression changes in specific genes

Bordini et al. reported reduced gbpA and slpA expression after terpinen-4-ol treatment.

Oral care

Candida reference strains respond to a concentration series

Original Figure 1A–B. C. albicans SC5314 and ATCC90028; XTT metabolic activity.

Francisconi et al. Braz Oral Res. 2020. DOI: 10.1590/1807-3107bor-2020.vol34.0050.

Figure labels: TTO; T-4-ol; nystatin; control; O.D.492 nm XTT absorbance.

Test exposure: 24 h. Different letters indicate statistically significant differences between groups.

Oral care

Clinical Candida isolates show differing responses

Original Figure 1C–D. Clinical genotypes A and B; XTT metabolic activity.

Francisconi et al. Braz Oral Res. 2020. DOI: 10.1590/1807-3107bor-2020.vol34.0050.

Figure labels: genotypes A/B; TTO; T-4-ol; nystatin.

Strain differences indicate the need to assess a panel of relevant microorganisms in the target formulation.

Oral care

Strain-dependent biofilm responses on denture resin

Original Figure 2. Biofilm grown on denture resin for 72 h, then treated for 60 s.

Francisconi et al. Braz Oral Res. 2020. DOI: 10.1590/1807-3107bor-2020.vol34.0050.

Figure labels: control; TTO; T-4-ol; Nys; original statistical letters and concentrations retained.

8.86 mg/mL

Terpinen-4-ol treatment concentration

Reference strains

XTT signals decreased, with statistical letters differing from control.

For clinical genotypes A and B, the terpinen-4-ol and control groups shared statistical letters.

Oral care

Confocal imaging shows altered Candida biofilm structure

Original Figure 3. A: ATCC 90028; B: SC 5314. Denture-resin biofilms grown for 72 h and treated for 60 s.

Francisconi et al. Braz Oral Res. 2020. DOI: 10.1590/1807-3107bor-2020.vol34.0050.

Figure labels: control; nystatin; terpinen-4-ol; TTO. A/B correspond to the strains specified in the text.

Oral care

Mouthrinse performance depends on clinical study design

Randomized, double-blind, 4 × 4 crossover trial. Twenty participants; 5-day plaque-regrowth model.

Rahman et al. Contemp Clin Dent. 2014. DOI: 10.4103/0976-237X.142813.

Study element Results and interpretation
Test formulation 1.5% tea tree oil mouthrinse, twice daily
Comparators 0.12% chlorhexidine, 0.05% CPC and colored-water placebo
Plaque index No significant difference between tea tree oil and placebo
Gingival bleeding No significant difference among rinses after 5 days

Mechanical oral hygiene stopped during each test period, with a 2-week washout between periods.

Oral care

An adjunctive mouthrinse trial assesses plaque and gingival indices

1% v/v tea tree oil mouthrinse versus 0.12% chlorhexidine; 14 participants per group; 15 days.

Menat et al. Front Oral Health. 2026. DOI: 10.3389/froh.2026.1727735.

Endpoint Plaque index
Tea tree oil: baseline → day 15 0.94 ± 0.33 → 0.45 ± 0.13
Chlorhexidine: baseline → day 15 0.69 ± 0.37 → 0.19 ± 0.16
Between-group P for change 0.889
Endpoint Gingival index
Tea tree oil: baseline → day 15 0.54 ± 0.19 → 0.19 ± 0.07
Chlorhexidine: baseline → day 15 0.49 ± 0.13 → 0.18 ± 0.11
Between-group P for change 0.560

Both groups improved from baseline (P < 0.001). All participants also received scaling and oral-hygiene instruction.

Oral care

Bacterial counts yield a different comparison

Selected data from original Table 1 and microbiology results; mean log(CFU/mL) ± SD.

Menat et al. Front Oral Health. 2026. DOI: 10.3389/froh.2026.1727735.

Microbial category Streptococcus spp.
Tea tree oil: baseline → day 15 5.45 ± 1.07 → 4.71 ± 1.16
Chlorhexidine: baseline → day 15 5.08 ± 1.17 → 3.45 ± 1.50
Between-group P 0.006
Microbial category Total anaerobes
Tea tree oil: baseline → day 15 5.90 ± 0.83 → 5.42 ± 0.82
Chlorhexidine: baseline → day 15 5.50 ± 1.18 → 4.39 ± 1.22
Between-group P < 0.001

Bacterial counts fell more with chlorhexidine. Clinical indices and microbiological endpoints answer different questions.

Oral care

Participant-reported taste informs oral formulation design

Original Figure 2. Experiences reported after 15 days; n = 14 per group.

Menat et al. Front Oral Health. 2026. DOI: 10.3389/froh.2026.1727735.

Figure labels: none; relief; allergic reactions; increased salivation; altered taste perception; tingling; dry mouth; strong taste; bleeding; change in oral sensitivity; burning. Control and experimental groups retained.

Taste is an important formulation variable

Test: 1% tea tree oil mouthrinse.

Control: 0.12% chlorhexidine.

“Strong taste” was reported by 64.3% and 28.6%, respectively.

Oral care

Oral concepts focus on surface contact and biofilms

Bordini et al. Biofouling. 2018. DOI: 10.1080/08927014.2018.1504926. Francisconi et al. Braz Oral Res. 2020. DOI: 10.1590/1807-3107bor-2020.vol34.0050.

Toothpaste

Need: daily surface cleansing. Role: evaluate activity in abrasive/surfactant bases, accounting for saliva dilution and brief contact.

Mouthrinse

Need: broader surface contact. Role: assess dispersion, taste, exposure time and residual biofilm activity in a rinsing model.

Localized oral-care formulation

Need: care of a target surface. Role: assess residence and material interactions alongside oral-mucosal tolerability.

Formulation development

Four application areas define formulation priorities

Application Skin care
Target need Clarifying and comfort care
Evidence focus Bacterial studies + monocyte-mediator research
Formats Serums, gels, lotions, cleansers
Application Eyelid and periocular care
Target need External cleansing
Evidence focus Mite-contact experiments + clinical care regimens
Formats Wipes, foams, skin-care formulations
Application Scalp and hair care
Target need Scalp cleansing and dandruff-related concerns
Evidence focus Malassezia experiments + tea tree oil shampoo trial
Formats Shampoos, cleansers, scalp serums
Application Oral care
Target need Cleansing of surface biofilms
Evidence focus Biofilm metabolism + adhesion-related genes
Formats Toothpastes, rinses, localized oral care

These roles and formats are development concepts. Validation should account for each study’s material and model.

Formulation development

An active-content calculation example

Conditional calculation: assume 4-TERPINEOL active content of 20% w/w in the ingredient.

Calculation basis: active content assumed at 20% w/w, with ingredient addition also expressed as % w/w.

Ingredient addition, % w/w Calculated finished-product 4-TERPINEOL, % w/w
0.50% 0.10%
1.00% 0.20%
2.00% 0.40%

Finished-product active content (%) = ingredient addition (%) × 0.20

The 20% mass-fraction basis requires confirmation in the specification. This table is arithmetic only, not a recommended use-level range.

Formulation development

Formulation testing should connect delivery design and use conditions

Akbarzadeh et al. Nanoscale Res Lett. 2013. DOI: 10.1186/1556-276X-8-102.

Development question Formulation assessment
Does the active remain uniformly dispersed? Appearance, phase behavior and uniformity of active content after incorporation
Can the formulation maintain target performance? Active content, physical stability and packaging compatibility over the intended shelf life
Do contact conditions match use? Rinse dilution, contact time, wipe delivery or leave-on coverage
Is the finished product appropriate for the intended site? Skin, eyelid or oral tolerance, with endpoints matching the intended cosmetic claim

Processing temperature, pH, shear and addition stage should follow the technical documentation for this product.

PuriPharm Co. Ltd.

Developing targeted care with a defined active

PuriPharm Co. Ltd. PURISOME technology brand document, v1.0, July 17, 2026.

NanoActive 4-TERPINEOL 20%

Terpinen-4-ol Nanoliposomes

Biological research on terpinen-4-ol

PURISOME® phospholipid delivery design

Skin, eyelid, scalp and oral-care development

Develop care products

with PuriPharm

Discuss sample evaluation, formulation fit and efficacy-evidence plans for the intended application.

Supported by PURISOME® Liposome Technology

NanoActive™ SA

NanoActive™ SA

Nanoencapsulated salicylic acid: skin renewal and scalp clarity

Corneocyte shedding · Comedonal acne research · Scalp and dandruff studies · Liposomal delivery evidence

Salicylic acid crystals · Polarized-light micrograph

NANOACTIVE™ SA / Product information

One molecule, two formulation applications

SA:2-Hydroxybenzoic acid

Active INCI: SALICYLIC ACID; CAS: 69-72-7; molecular formula: C7H6O3; molecular weight: 138.12 g/mol.

Skin care

Supports skin renewal and controlled exfoliation; care for open comedones and blemish-prone skin; formulations for clearer pores and smoother skin texture.

Scalp and hair care

Advanced salicylic acid delivery system

Scalp exfoliation, dandruff management, buildup removal, and improved surface comfort.

Molecular science / Formulation considerations

Solubility, ionization, and lipid affinity guide formulation design

Water solubility at 25°C

2.24 mg/mL

Aqueous phase

Lipid domain

Limited water solubility makes carrier selection central to aqueous formulation design.

pKa 2.9 · Acid/salicylate equilibrium; log Po/w 2.25 · Lipid affinity; saturated aqueous solution pH 2.4.

pH changes the ionization state; salicylates and the free acid are chemically distinct.

Delivery design should address molecular form and be supported by specific evidence.

Skin science / Corneocyte cohesion

Salicylic acid promotes shedding by reducing intercorneocyte cohesion

Normal human stratum corneum / 1980

Stratum corneum / Schematic

Promotes corneocyte shedding

Corneocyte

Corneocyte

Reduces cohesion between corneocytes

No effect on normal epidermal mitotic activity was detected. This study does not support a proliferation-based renewal claim.

Roberts DL, Marshall R, Marks R. Br J Dermatol. 1980;103(2):191–196. DOI: 10.1111/j.1365-2133.1980.tb06590.x.

Mechanistic and animal evidence / Sebocytes and rabbit ear acne model

Salicylic acid inhibited sebocyte lipogenesis and inflammatory pathways and reduced follicular dilation in a rabbit ear acne model

Human SEB-1 sebocytes / 50–100 μM salicylic acid

p-AMPK ↑ → SREBP-1 / FAS / ACC ↓; total lipid content decreased by 27.9% and 41.2% at 50 μM and 100 μM, respectively.

NF-κB signaling ↓; IL-1β, IL-6, IL-8, TNF-α, and OSM were measured after stimulation with heat-killed Propionibacterium acnes.

SREBP-1a and SREBP-1c transcripts decreased by approximately 40%; FAS and ACC decreased by 28.1% and 33.4%, respectively. Immunoblotting supported reductions in precursor and mature SREBP-1.

Rabbit ear acne model / Daily gel application for 3 weeks

Salicylic acid gel Baseline Week 3
1% 110.0 61.4
2% 96.7 63.7
Endpoint Dilated follicles/cm²

Histopathology and immunohistochemistry supported the cellular mechanisms. Across the reported groups and outcomes, IL-6, SREBP-1, NF-κB p65, and OSM protein levels decreased by approximately 53.7–81.3%.

These mechanistic and animal findings apply to the tested salicylic acid materials and doses. They cannot be directly extrapolated to untested finished NanoActive™ SA formulations.

Lu J et al. Experimental Dermatology. 2019;28(7):786–794. DOI: 10.1111/exd.13934. PMID: 30972839.

Animal evidence / 28-day study in normal mouse skin

Daily 0.5–5% supramolecular salicylic acid caused no obvious inflammatory or degenerative changes in normal mouse skin

Study design

C57BL/6 mice; vehicle or 0.5%, 1%, 2%, or 5% supramolecular salicylic acid hydrogel; once daily, 20 mg/cm²; histology on days 14 and 28; n = 3 per group per time point.

The original H&E images retain group labels, day 14/28 rows, and 50 μm scale bars.

Zhou C et al. Drug Des Devel Ther. 2023;17:1593–1609. Original Figure 1A–B. PMCID: PMC10228590.

Animal mechanisms / Barrier-related transcriptomics

Supramolecular salicylic acid upregulated genes associated with cornification, lipid lamellae, and cell junctions in mouse skin

Original Figure 5A: barrier-related Gene Ontology (GO) terms on days 14 and 28.

In the 5% supramolecular salicylic acid group, expression increased for genes related to cornified envelope formation, filaggrin metabolism, intercellular lipid lamellae, desmosomes, tight junctions, and antimicrobial peptides. These are mouse transcriptomic findings, rather than evidence of clinical barrier benefits in humans.

Zhou C et al. Drug Des Devel Ther. 2023;17:1593–1609. Original Figure 5A–B. DOI: 10.2147/DDDT.S397541.

Human skin evidence / Vehicle-controlled study

Open comedones improved; closed comedones showed the same reduction as vehicle

0.5% salicylic acid / 12 weeks

Reduction from baseline at week 12 (%)

Comedone type Salicylic acid Vehicle
Open comedones 39% 28%
Closed comedones 21% 21%

39% vs 28%

Open-comedone reduction: salicylic acid versus vehicle; the authors reported a statistically significant difference.

21% = 21%

Closed-comedone reductions did not differ between groups, indicating that comedone type affects the outcome.

Test product: 0.5% salicylic acid in an alcohol–detergent vehicle. Values summarized from Liu H et al., Cochrane Database Syst Rev. 2020, Analysis 5.5; Shalita AR. Cutis. 1981. PMID: 6458457.

Human skin evidence / Multicenter randomized trial

A 500-participant trial found no significant difference in overall improvement between 2% supramolecular salicylic acid and adapalene

Test: 2% supramolecular salicylic acid hydrogel; comparator: adapalene gel; randomized, evaluator-blind, parallel-controlled design.

n = 249 / 2% supramolecular salicylic acid; n = 251 / adapalene.

Clearance plus marked improvement at week 12

Group Clearance + marked improvement
2% supramolecular salicylic acid 51.01%
Adapalene gel 43.10%

Between-group p = 0.0831; no statistically significant difference.

Once daily for 16 weeks, as stated in the presentation; the overall improvement results shown here are from week 12.

Adverse event rates: 0.40% versus 0.80%; no statistically significant between-group difference.

Ye CX et al. J Cosmet Dermatol. 2024;23(6):2125–2134. DOI: 10.1111/jocd.16238. PMID: 38590107.

Human skin evidence / Original trial tables

Original tables from the 500-participant trial document lesion improvement and adverse events

Table 2: lesion improvement at T12; TG = test group, CG = control group.

Table 3: adverse event summary; no serious adverse events occurred.

Ye CX et al. J Cosmet Dermatol. 2024;23(6):2125–2134. Original Tables 2 and 3. DOI: 10.1111/jocd.16238.

Human skin evidence / Standardized clinical photographs

Inflammatory acne visibly decreased on the forehead and cheeks in both groups

Trial overview

500 enrolled; 479 completed; 2% supramolecular salicylic acid once daily; adapalene comparator; multicenter, randomized, evaluator-blind trial.

Photographs show individual responses. Randomized group analyses remain the main quantitative evidence.

Ye CX et al. J Cosmet Dermatol. 2024. Original Figure 2; 2% supramolecular salicylic acid hydrogel versus adapalene gel.

Human skin evidence / Skin color, TEWL, and hydration

Physiological measures changed over time, with no significant between-group differences

Interpreting the results

L* increased from baseline at several visits. TEWL decreased at T8, T12, and T16 in the supramolecular salicylic acid group. Hydration decreased at T1 in both groups. None of the physiological measures differed significantly between groups.

T16 was 4 weeks after product discontinuation.

Ye CX et al. J Cosmet Dermatol. 2024. Original Figure 3A–E: L*, a*, b*, TEWL, and hydration.

Human skin evidence / Original physiological data table

The original table records within-group physiological changes across all 7 visits

Within-group comparisons use baseline as the reference. The authors reported no significant between-group differences for any physiological measure.

Ye CX et al. J Cosmet Dermatol. 2024. Original Table 4: summary statistics for physiological measures.

Human skin evidence / Sebum, pores, and fine lines

Pore count differed significantly between groups at T1

Original Table 5: summary of improvement rates for physiological measures.

Original Figure 4: changes in sebum, pores, and fine lines over time.

The authors specifically identified a between-group difference in pore count at T1. This should not be described as lasting pore reduction.

Ye CX et al. J Cosmet Dermatol. 2024. Original Table 5 and Figure 4. DOI: 10.1111/jocd.16238.

Human skin evidence / Microbiome · 2% supramolecular salicylic acid for 8 weeks

Changes in facial microbial diversity accompanied improvements in lesion count and GAGS

30 participants with acne plus 10 non-acne controls; 2% supramolecular salicylic acid for 8 weeks.

Outcome Before treatment After treatment
Lesion count 39.67 ± 7.18 25.90 ± 8.40
GAGS 14.20 ± 2.71 10.37 ± 3.12
p value < 0.0001 < 0.0001

Table 1 values reformatted for readability; BT = before treatment, AT = after treatment.

Bilal H et al. Pharmaceuticals. 2023;16(1):87. Table 1 and original Figure 1. PMCID: PMC9864713.

Human skin evidence / Microbial community structure

β-diversity tests found no significant difference between the post-treatment and control groups

Post-treatment versus control: ANOSIM: R = −0.028, p = 0.6; perMANOVA: R = 0.031, p = 0.257.

Original Figure 2: β-diversity. Original Figure 4: genus-level relative abundance and between-group comparisons.

Bilal H et al. Pharmaceuticals. 2023;16:87. Original Figures 2 and 4 and Table 2. DOI: 10.3390/ph16010087.

Human skin evidence / 21-day combination gel study

After 21 days of a multi-ingredient gel, forehead sebum decreased by 23.65% and IGA by 23.81%

n = 42; twice daily for 21 days; 2% salicylic acid + 2.9% glycolic acid + 2.5% lactic acid + niacinamide + three ceramides. Single-center prospective study; effects cannot be attributed to salicylic acid alone.


Liu Y et al. J Cosmet Dermatol. 2025;24(7):e70353. Original Figures 1 and 4. PMCID: PMC12274963.

Human skin evidence / Short-term forearm measures

Short-term forearm testing assessed hydration and TEWL recovery after tape stripping

Hydration immediately and at 3 and 6 hours; sample and control areas.

TEWL recovery after tape stripping; short-term forearm protocol.

Liu Y et al. J Cosmet Dermatol. 2025. Original Figures 2 and 3: hydration and TEWL after tape stripping.

Professional 30% peels / Clinical and barrier measures

GAGS and skin barrier measures improved after serial 30% supramolecular salicylic acid peels in 28 patients

Professional peels

n = 28; 30% supramolecular salicylic acid; once every 2 weeks for 2 months; GAGS, pH, sebum, TEWL, hydration, and red areas.

Post-peel burning/stinging: 25 patients; erythema: 3 patients. These data cannot be extrapolated to everyday leave-on cosmetics.

Shao X et al. Dermatol Ther (Heidelb). 2023;13:155–168. Original Figure 1. PMCID: PMC9823178.

Professional 30% peels / Perilesional immunohistochemistry

Post-peel perilesional biopsies showed lower inflammatory markers and higher caveolin-1

IL-1α ↓ · IL-6 ↓ · IL-17 ↓ · TGF-β ↓ · TLR2 ↓ · Caveolin-1 ↑

Shao X et al. Dermatol Ther (Heidelb). 2023;13:155–168. Original Figure 3. DOI: 10.1007/s13555-022-00844-5.

Professional 30% peels / Korean acne study

Serial 30% salicylic acid peels reduced inflammatory and non-inflammatory lesions in Korean patients

Korean patients · Fitzpatrick skin types III–IV

n = 35; single-blind, uncontrolled; 30% salicylic acid once every 2 weeks for 5 sessions; total lesions: 68.2 → 39 at week 12; non-inflammatory lesions: 43 → 28; inflammatory lesions: 25 → 11.

Acne grade decreased by 1.29 (p < 0.01). No significant barrier changes, persistent post-inflammatory hyperpigmentation, or scarring were observed. Original Table 1 prints “554.3” at week 6, a suspected source typographical error. Professional peel data do not support leave-on product claims.

No visit differed significantly from baseline. The week 6 hydration value “554.3” is retained as printed in the original table.

Lee HS, Kim IH. Dermatol Surg. 2003;29:1196–1199. Original Figures 3–4 and Table 1.

Professional 30% peels / Japanese comedonal acne study

Mean comedone count decreased by 75% after five 30% salicylic acid–PEG peels in Japanese patients

n = 16; comedone count: 39.3 → 9.2; once every 2 weeks for 5 sessions, 5 minutes each; blinded photographic assessment; no parallel control.

Severity: baseline II → grade I at week 12.

Original notes: comedones were counted at each visit and 2 weeks after the last peel; counts declined with treatment duration. A blinded observer reported an overall reduction in severity, consistent with lesion counts. Grades based on one side of the face: I (<10), II (10–25), III (severe, 25–50), IV (>50); thresholds retained as printed.

Hashimoto Y et al. Dermatol Surg. 2008;34:276–279. Original Figure 1 and Table 1. DOI: 10.1111/j.1524-4725.2007.34055.x.

From skin to scalp / A shared surface target

Retained corneocyte material links follicular plugging and scalp flaking

Skin / Follicular opening

Keratinous buildup at the follicular opening connects shedding biology with open-comedone and surface-texture care.

Scalp / Surface and contact time

Adherent flakes and surface buildup create another formulation setting: spreading through hair, rinsing, and routine maintenance.

Biological principles connect skin and scalp. Interpret leave-on and rinse-off evidence in the context of the specific product format.

Scalp evidence / Controlled studies

Flaking scores and corneocyte counts provide controlled evidence for scalp outcomes

1987

Double-blind, four-arm shampoo comparison

n = 48; supervised shampooing twice weekly for 5 weeks; clinical scaling scores plus shed corneocytes/cm².

Comparison arms
2% salicylic acid
2% sulfur
Both actives combined
Vehicle

The combination produced significantly greater and earlier reductions than either active alone or the vehicle.

2002

Randomized, single-blind comparison

n = 154; three times weekly for 4 weeks plus 2 weeks of follow-up. Test: 1.5% ciclopirox olamine + 3% salicylic acid. Comparator: 2% ketoconazole.

Both shampoos improved dandruff and scaling on days 29 and 43. In the seborrheic dermatitis subgroup, pruritus improved significantly only with the ciclopirox olamine–salicylic acid formula.

Leyden JJ et al. Cutis. 1987;39(6):557–561. PMID: 3301220. · Squire RA, Goode K. J Dermatolog Treat. 2002;13(2):51–60. PMID: 12060502.

Scalp evidence / 4-week shampoo study

Severe dandruff decreased from 28.4% to 3.2% after 4 weeks

n = 95 dermatologists; self-controlled assessment; 1% selenium disulfide + 0.9% salicylic acid shampoo; three times weekly for 4 weeks.

Original Figure 1 · Severity distribution

Original Figure 2 · Mean VAS scores ± SD

90.5%

Reported mild or no dandruff on day 28; all VAS scores improved (p < 0.01).

Chen X, Li J, Li Y, Wei A. Arch Dermatol Res. 2025;317(1):680. Figures 1–2. DOI: 10.1007/s00403-025-04165-3.

Scalp evidence / Day 0 to day 28 photographs

Two representative participants showed visible improvement in dandruff, erythema, and scalp lesions

Participant A · Day 0 (left) and day 28 (right)

Participant B · Day 0 (left) and day 28 (right)

95 dermatologists; self-controlled assessment; 1% selenium disulfide + 0.9% salicylic acid shampoo, three times weekly for 4 weeks. Photographs illustrate responses to a combination product.

Chen X et al. Arch Dermatol Res. 2025;317:680. Original Figures 3 and 4. PMCID: PMC11976785.

Scalp evidence / Two-step regimen

Mean dandruff score decreased by 55% after 4 weeks of combination scalp care

n = 20; prospective cohort; salicylic acid/piroctone olamine/zinc PCA pre-wash gel combined with a salicylic acid/piroctone olamine/antimicrobial peptide cleanser.

Baseline → Week 4

2.45 → 1.10

±0.50 ±0.30

Percentage reduction calculated from published mean scores; p < 0.01.

Original Figure 1: mean dandruff score (A) and efficacy index (B); error bars show SD. ** p < 0.01.

After 4 weeks of combination care, cleanser maintenance continued for 12 weeks. Ge L et al. J Cosmet Dermatol. 2025;24(1):e16742. Figure 1 and Table 3.

Scalp evidence / Surface comfort and greasiness

Pruritus and greasiness scores decreased alongside dandruff

Pruritus / Original Figure 2

2.35 → 1.10

Baseline to week 4; p < 0.01. With continued maintenance, the score reached 1.00 from week 8 onward.

Greasiness / Original Figure 4

2.60 → 1.40

Baseline to week 4; p < 0.01. Perceived surface greasiness differs from sebum secretion rate.

The same 20-participant combination-care study; original figures retain means and SD. Ge L et al., 2025. Figures 2 and 4 and Table 3. DOI: 10.1111/jocd.16742.

Scalp evidence / Clinical and trichoscopic images

Clinical and trichoscopic images document improved surface cleanliness through week 16

Week 16 / Overall response

80%

Achieved marked overall clinical improvement (efficacy index ≥50%).

Weeks 0–4: pre-wash gel once weekly plus cleanser every 1–3 days. Weeks 4–16: cleanser maintenance.

All 20 participants completed the study; no adverse events were reported. Two dandruff recurrences occurred during weeks 12–16 and resolved after increasing cleanser frequency.

Original Figure 6

Combination regimen containing salicylic acid; images from two representative participants. Ge L et al. J Cosmet Dermatol. 2025;24(1):e16742. Figure 6 and Table 4.

Scalp evidence / Erythema and total symptom scores

The combination regimen sustained reductions in erythema and total symptom scores during maintenance

n = 20; salicylic acid/piroctone olamine pre-wash gel plus cleanser for 4 weeks, followed by cleanser maintenance for 12 weeks. At week 16, 80% achieved marked overall improvement.

Figure 3: erythema score decreased from 1.55 at baseline to 1.10 at week 4 (p < 0.05).

Figure 5: total symptom scores and efficacy index over 16 weeks.

Ge L et al. J Cosmet Dermatol. 2025;24(1):e16742. Original Figures 3 and 5 and Tables 3–4.

Scalp evidence / 5-participant supramolecular salicylic acid–zinc pyrithione pilot study

Dermoscopic findings and ASFS improved within 14 days in a small self-controlled scalp study

Test product and design

n = 5; 2% supramolecular salicylic acid + 0.8% zinc pyrithione; daily for 14 days; 3 scalp regions; D0, D7, and D14.

Original dermoscopic images and ASFS results. This exploratory study cannot separate the contributions of the two actives.

Wang Q et al. J Cosmet Dermatol. 2025;24:e16617. Original Figure 2. PMCID: PMC11743326.
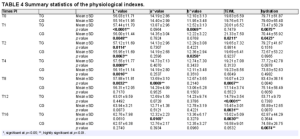
Scalp evidence / Sebum, TEWL, pH, and hydration

The supramolecular salicylic acid–zinc pyrithione combination reduced scalp sebum and TEWL, with no significant hydration change

Example sites on the forehead

Sebum, day 0 → day 14: left forehead: 123.05 → 62.20 μg/cm²; right forehead: 103.29 → 54.08 μg/cm².

5 participants, multiple scalp regions. Hydration did not change significantly. Findings apply to the combined supramolecular salicylic acid–zinc pyrithione regimen.

Wang Q et al. J Cosmet Dermatol. 2025;24:e16617. Original Figure 3. DOI: 10.1111/jocd.16617.
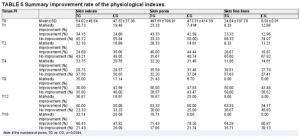
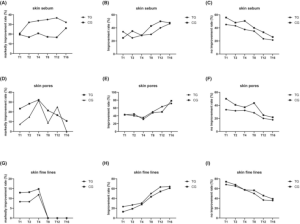
Scalp evidence / Fungal spore counts

Fungal spore counts decreased in all 3 scalp regions during the 14-day pilot study

Original assay findings

Forehead, vertex, and occiput; days 0, 7, and 14; representative fluorescence images and quantitative fungal spore counts.

n = 5; combination supramolecular salicylic acid–zinc pyrithione product. Microbiological findings are preliminary and formulation-specific.

Wang Q et al. J Cosmet Dermatol. 2025;24:e16617. Original Figure 4. PMCID: PMC11743326.

Delivery science / Liposome design

Liposomal design addresses molecular location and the external-phase formula

Active molecule

Free salicylic acid

Limited water solubility; pH-dependent ionization; affinity for lipid domains; activity distinct from salicylates.

Formulation system

Bilayer: free-acid association and lipid compatibility. External aqueous phase: pH, rheology, and excipient compatibility. Conditions of use: release, deposition, and local exposure.

Phospholipid bilayer

Schematic of the liposomal formulation design space; not a particle-size or structural specification.

Each formulation requires its own performance testing.

Scientific basis: Bhalerao SS, Raje Harshal A. Drug Dev Ind Pharm. 2003; EP0616799A1, 1994.

Delivery evidence / Release and ex vivo porcine skin

Liposomal gel increased ex vivo permeation and skin retention compared with plain salicylic acid gel

Higuchi release model: R² = 0.9181; the gel released 64.48% within 360 min.

Porcine skin, 480 min: permeation 26.50% versus 17.20% with plain gel; mean ± SD, n = 3.

Skin retention: 10.90% with liposomal gel versus 5.30% with plain gel, approximately a 2-fold increase.

Chandwani S et al. Int J Appl Pharm. 2023;15(3):220–233. Foot-corn formulation study. Original Figures 16–17 and skin retention results.

Delivery evidence / Patent example and human tape stripping

A patent example combines free-acid liposomes with external-phase pH adjustment

Example 1 / Parts by weight

Salicylic acid 10.0
Lecithin 1.0
Water 83.0
Arginine 4.0
Preservative combination + vitamin E acetate 1.0 + 1.0

Process and testing

High-shear extrusion: 12,000 psi through 100 μm apertures. Dynamic light scattering: 200 nm; pH increased from 2.0 to 6.7 after arginine addition. Carboxyfluorescein labeling and freeze-fracture TEM supported vesicular structure.

Permeation protocol: volar human forearm; tape stripping plus HPLC; both liposomes and the 10% salicylic acid emulsion comparator were diluted 1:10 with polymethacrylate gel.

Original Figure 1 · Salicylic acid recovered from sequential skin tape strips

EP0616799A1. Cosmetic delivery system for salicylic acid and process for preparation of same. Published 1994. Example 1 and Figure 1.

Safety and regulatory context / SCCS Final Opinion

SCCS safety conclusions depend on product type, concentration, and exposure route

SCCS/1646/22 · Final Opinion

0.5% as a preservative; 3.0% in rinse-off hair products; 2.0% in other products, excluding specified categories; 0.5% in body lotions, eye shadow, mascara, eyeliner, lipstick, oral products, and non-spray deodorants. These concentrations include all uses; preservative use must not be added on top.

Not applicable to sprayable products that may expose the lungs. Salicylic acid is an eye irritant. Products for children under 3 years were not considered. Check current regulations in the target market.

SCCS/1646/22, Final Opinion, 2023, summary p. 4. Earlier restrictions: SCCS/1601/18, 2018; corrigendum 2019.

Formulation and applications / Development pathways

One delivery ingredient, two evidence-based product development pathways

Skin renewal and comedone care

Leave-on: pore-clearing serums, exfoliating toners, and texture-refining lotions. Rinse-off: advanced salicylic acid cleansers.

Relevant measures: open and closed comedones, standardized imaging, surface shedding, roughness, hydration, TEWL, and local tolerability.

Scalp exfoliation and dandruff care

Pre-wash: scalp exfoliating gels or buildup-removal treatments. Cleansing: dandruff-care shampoos. Leave-on: scalp renewal serums.

Relevant measures: adherent scalp flakes, corneocyte counts, pruritus, greasiness, erythema, trichoscopy, combability, and regimen-specific tolerability.

Finished-product salicylic acid (%) = ingredient use level (%) × confirmed salicylic acid fraction in the ingredient.

Confirm pH, rheology, assay, stability, preservation, and packaging. Free salicylic acid has approximately 0.2% water solubility at 20°C; clear aqueous systems require crystallization control (Merck 2019).

Ingredient use level is not the salicylic acid concentration. Translate leave-on and rinse-off evidence according to actual use conditions.

NANOACTIVE™ SA / Product characterization

NanoActive™ SA nanoencapsulated salicylic acid uses a phospholipid delivery system with particle size <30 nm

Left: laser particle-size distribution (x-axis: Size, d.nm; y-axis: Volume, %). Right: electron micrograph; scale bar 50 nm.

NANOACTIVE™ SA / D0–D28 product results

NanoActive™ SA nanoencapsulated salicylic acid: visible improvement in oily skin from D0 to D28

Text in the original image: 96% of users were satisfied with the product containing NanoActive SA. Reported oily-skin improvements include refined pores, reduced sebum secretion, and fewer comedones. Top photograph: D0; bottom: D28.

Evidence translation / Product performance

NanoActive™ SA combines salicylic acid science with product-specific performance

Salicylic acid science

Promotes corneocyte shedding; modulates sebocyte lipogenesis and inflammatory signaling; lesion, sebum, scalp, and dandruff outcomes from tested formulations; research on liposomal release and skin delivery.

NANOACTIVE™ SA product features

Phospholipid delivery system; particle size <30 nm; recommended ingredient use level: 1–5%; user satisfaction at D28: 96%; improvements in pores, sebum, and comedones.

Formulation and handling

Add at low temperature; avoid divalent/trivalent metal ions; store below 25°C protected from light; suitable for skin and scalp formulations.

NanoActive™ SA nanoencapsulated salicylic acid for skin renewal, oily skin care, and scalp clarity.

PuriActives®PMT-100

PuriActives® PMT-100 | Palmitoyl Methoxytryptamine

INCI: PALMITOYL METHOXYTRYPTAMINE

A lipophilic active for skin conditioning and anti-aging formulations

5-Methoxyindole · Ethylamide linker · C16 palmitoyl chain

Molecular structure, human studies reported in patents, and formulation applications

Product value and scientific evidence

PMT-100: Evidence for topical use and formulation applications

Human and skin studies

A cream containing 1.5% PMT was studied in humans for four weeks. A separate experiment tracked the distribution of radiolabeled analogues in skin.

Proposed mechanisms

Patents link PMT to skin surface conditioning and the biology of free 5-MT. The original cell study figures shown below concern free 5-MT.

Formulation development

The powder has an HPLC assay of ≥98.0% and is suitable for oil-phase formulation development. Historical patents provide examples across several product formats.

Greff D. WO1998006695A1, Examples 1 and 3. Janjetovic Z et al. J Pineal Res. 2014. DOI: 10.1111/jpi.12146. PuriPharm technical documentation.

Product profile and molecular structure

The C16 acyl chain distinguishes PMT structurally

Item

Product information

INCI

PALMITOYL METHOXYTRYPTAMINE

Chemical name

N-Hexadecanoyl-5-methoxytryptamine

Molecular formula / molar mass

C₂₇H₄₄N₂O₂ / 428.65 g/mol

CAS / UNII

151922-15-5 / 2298R31N7A

Physical form / assay

Powder / ≥98.0% (HPLC)

5-Methoxyindole + ethylamide linker + palmitoyl chain

Free 5-MT: no acyl group; melatonin: C2 acetyl group; PMT: C16 palmitoyl group.

PuriPharm technical documentation; NCATS: 2298R31N7A; Villano R, Di Marzo V. Front Chem. 2024. DOI: 10.3389/fchem.2024.1436008, Scheme 5.

Evidence for topical use | Human study

Four-week human study of a 1.5% PMT cream

WO1998006695A1, Example 3

25 Female participants · 32–59 Age (years) · 4 weeks Study duration

Split-face comparison within each participant

A 1.5% N-palmitoyl-5-MT cream was applied to one side of the face and a placebo cream to the other. Participants were blinded to assignment.

Outcomes: sebum measurements, stratum corneum hydration, firmness/tension, clinical assessments, and self-assessments.

Greff D. WO1998006695A1, Example 3, pp. 4–5 of the description.

Evidence for topical use | Human study results

The patent reports increases in skin hydration and firmness

1.5% N-palmitoyl-5-MT cream; 25 women; 4 weeks.

Outcome

Active cream side

Placebo side

Sebum reading

−27%

Stable

Skin hydration

+35%

Numerical change not reported

Firmness / tension

+31%

−2%

Adapted from Example 3. Values show changes from baseline. The source does not report variability measures or P values.

Greff D. WO1998006695A1, Example 3, pp. 4–5 of the description.

Evidence for topical use | Skin distribution

An ex vivo study tracked tracer distribution across skin layers

Example 1 compared radiolabeled 2-iodo derivatives in a Franz-type diffusion model.

30 min, 1 h, 2 h, and 4 h

Superficial tape strips ↓Epidermis ↓Dermis ↓Receptor fluid

Radioactivity in the different layers was measured by sequential tape stripping, tissue separation, and scintillation counting.

Test materials: ¹²⁵I-labeled 2-iodomelatonin and 2-iodo-N-palmitoyl-5-methoxytryptamine.

Greff D. WO1998006695A1, Example 1, pp. 3–4 of the description.

Evidence for topical use | Skin distribution

The patent reports epidermal retention of the palmitoylated tracer

155-foldEpidermal radioactivity of the palmitoylated tracerCompared with the melatonin tracer in the patent experiment

Skin layer

Reported observation

Epidermis / deeper tape strips

Palmitoylated tracer concentrated here

Dermis / receptor fluid

Very low radioactivity

Superficial tape strips

Most of the melatonin tracer remained here

The measurement time and variability for this ratio were not specified. The results describe tracer distribution in skin.

Greff D. WO1998006695A1, Example 1, pp. 3–4 of the description.

Biological rationale | Mechanism proposed in the patent

Regulation of keratinization as a proposed mechanism for skin surface care

The patent links lipophilic methoxytryptamine derivatives to the conditioning of keratinized surfaces.

Topical contactThe dissolved or dispersed active contacts the skin surface.↓Keratin propertiesThe patent proposes an effect on keratin content or rigidity.↓Skin appearance and feelThe intended effects are a smoother feel and improved surface appearance.

This mechanism was proposed in the patent. The source did not quantify keratin biomarkers or verify receptor activation.

Poret JL. US20040022822A1, paragraphs 0021–0037 and Examples 1–4 and 7.

Biological rationale | Hypothetical conversion pathway

The patent proposes that PMT may be converted to free 5-MT

The proposed pathway involves enzymatic deacylation in the skin.

PMT · Palmitoylated molecule↓ Hypothetical amide bond hydrolysis5-MT · Free amine

Free 5-MT provides biological context

Subsequent experiments tested free 5-MT in human keratinocytes. The cited patent did not quantify the extent of PMT conversion to 5-MT in skin.

Greff D. WO1998006695A1, pp. 1–2 of the description: proposed enzymatic release of 5-methoxytryptamine.

Free 5-MT | Human keratinocyte model

5-MT reduced nitrite at a UVB dose of 25 mJ/cm²

​

Original Figure 3. HaCaT cells; 50 µM; 24 h pretreatment; measured 30 min after UVB exposure. Original groups, error bars, and statistical symbols are retained.

Janjetovic Z et al. J Pineal Res. 2014;57:90–102. DOI: 10.1111/jpi.12146.

Free 5-MT | Human keratinocyte model

5-MT reduced H₂O₂ at UVB doses of 25 and 50 mJ/cm²

​

Original Figure 4. HaCaT cells; 50 µM; 24 h pretreatment; measured 30 min after UVB exposure. * P < 0.05, ** P < 0.01, *** P < 0.001, **** P < 0.0001.

Janjetovic Z et al. J Pineal Res. 2014;57:90–102. DOI: 10.1111/jpi.12146.

Free 5-MT | Human keratinocyte model

5-MT increased reduced glutathione after UVB exposure

Original Figure 5. HaCaT cells; 50 µM; 24 h pretreatment; measured 1 h after UVB exposure. * P < 0.05, ** P < 0.01, *** P < 0.001.

Janjetovic Z et al. J Pineal Res. 2014;57:90–102. DOI: 10.1111/jpi.12146.

Free 5-MT | Human keratinocyte model

5-MT reduced CPD staining at 25 mJ/cm²

​

Original Figure 7

Primary keratinocytes (HEKn); 50 µM; 24 h pretreatment; measured 3 h after UVB exposure.

B: 25 mJ/cm², 5-MT P < 0.05; C: 50 mJ/cm², no significant difference for 5-MT.

CPD: cyclobutane pyrimidine dimer.

Janjetovic Z et al. J Pineal Res. 2014;57:90–102. DOI: 10.1111/jpi.12146.

Free 5-MT | Human keratinocyte model

The comet assay showed less DNA damage with 5-MT

​

Original Figure 8

HEKn cells; 50 µM; 24 h pretreatment; 200 mJ/cm² UVB; 3 h treatment after UVB exposure.

5-MT reduced the mean tail moment versus the UVB control (P < 0.05).

Janjetovic Z et al. J Pineal Res. 2014;57:90–102. DOI: 10.1111/jpi.12146.

Formulation development | Product concepts

Topical studies inform three skin care concepts

Moisturizing lotion

For skin that feels dry. Combine PMT with humectants and emollients, then assess hydration and skin feel.

Firming cream

For a firmer appearance. Use the patent study’s firmness measures to guide finished-product testing.

Balancing facial lotion

For skin that feels oily. At the target use level, assess sebum, shine, and sensory comfort.

Greff D. WO1998006695A1, Examples 1 and 3, pp. 3–5 of the description. PuriPharm Co. Ltd.: Palmitoyl Methoxytryptamine powder technical documentation.

Formulation development | Use levels

Supplier use levels for initial formulation development

Context

Use level / concentration

Development purpose

Supplier: standard face cream

0.05–0.20%

Initial formulation development

Supplier: intensive face cream

0.20–0.50%

Evaluate in the intended finished-product base

Human patent study: Example 3

1.50% PMT

Concentration used in the historical study

前插行后插行

PMT-100 is a product code. Calculate active content on the assay basis stated in the batch certificate of analysis (COA).

PuriPharm Co. Ltd.: Palmitoyl Methoxytryptamine powder technical documentation. Greff D. WO1998006695A1, Examples 1 and 3, pp. 3–5 of the description.

Formulation development | Incorporation and compatibility

Formulation integration and nanoencapsulated product support

Choose a suitable oil phase

The supplier lists heated cosmetic esters and lipids, including caprylic/capric triglyceride, squalane, and C12-15 alkyl benzoate.

Dissolve fully before emulsification

The technical documentation specifies 75–80 °C for dissolution. Fully dissolve the powder before combining the phases.

Check the formula after cooling

Check for recrystallization, cloudiness, and texture changes in the complete formula and final packaging.

Support for formulation challenges

PuriPharm offers NanoActive PMT, a nanoliposomal palmitoyl methoxytryptamine product, to help address formulation challenges.

PuriPharm Co. Ltd.: PMT-100 technical documentation and NanoActive PMT supply information.

Formulation examples | Published patent

Published PMT examples cover five cosmetic product formats

Example

Product format

PMT, % w/w

1

Skin care cream

2.00

2

Skin serum

3.00

3

Toner

0.50

4

Cleanser

1.00

7

Hair conditioner

1.00

前插行后插行

These historical formulas use concentrations reported separately from supplier use levels and the human study concentration.

Poret JL. US20040022822A1, Examples 1–4 and 7. PMT concentration: % w/w.

Patent Example 1 | Original formula table (part 1)

The cream example includes aqueous and lipid phases

​

Editable transcription

Ingredient (original wording)

w/w %

Water

53.47

Allantoin

0.20

Glycerin

3.00

Methyl paraben

0.25

Palmitoyl hydrolyzed wheat protein

1.00

Triethanolamine

0.15

Glycerin/water/PEG-8/caprylyl glycol/sodium polyacrylate

5.00

Petrolatum

2.00

Editable transcription

Ingredient (original wording)

w/w %

Squalane

4.00

Butyl methoxy dibenzoylmethane

0.25

Butylated hydroxy toluene

0.02

Propyl paraben

0.05

Octyl methoxycinnamate

0.75

Diazolidinyl urea

0.15

Sodium hyaluronate

0.01

Tocopheryl acetate

0.30

Sodium PCA

1.00

Fragrance

0.30

Cyclomethicone and dimethiconol

2.50

前插行后插行

The two portions of the original formula table are stacked in their original reading order. Original ingredient names and units are retained.

Poret JL. US20040022822A1, Example 1, first and middle portions of the original table.

Patent Example 1 | Original formula table (part 2)

The original cream formula contains 2.00% PMT

​

Editable transcription

Ingredient (original wording)

w/w %

Behenyl alcohol/arachidyl alcohol/stearyl alcohol

3.00

Coco-caprylate/caprate

2.00

Shorea stenoptera butter

5.00

Isononyl isononanoate

5.00

Pentaerythrityl tetraoctanoate

2.50

Glyceryl behenate

2.00

Polyacrylamide/water/C13-14 isoparaffin/laureth-7

2.00

Biosaccharide gum-1/phenoxyethanol/parabens

1.00

Palmitoyl-methoxytryptamine

2.00

Water/propylene glycol/hydrolyzed soy protein/phenoxyethanol/aloe barbadensis extract/parabens

1.00

Phenoxyethanol/methyldibromo glutaronitrile

0.10

前插行后插行

A documented emulsion system

The continuation includes PMT, emollients, structuring ingredients, and preservatives.

All original rows are retained, and the w/w header is repeated for readability.

Poret JL. US20040022822A1, Example 1, final portion of the original table.

Patent Example 3 | Original formula table

The toner example contains 0.50% PMT

​

Editable transcription

Ingredient (original wording)

w/w %

PPG-2 – Ceteareth-5

3.00

Trideceth-9, PEG-5 Octanoate

2.00

Menthol

0.01

Fragrance

0.20

Water

QS

Sericin

0.05

Hydrolyzed sweet almont protein

0.05

Propylene glycol

4.00

Preservatives

0.30

Tetrasodium EDTA

0.09

Benzophenone 4

0.05

Diazolidinyl urea

0.25

Colorants

0.01

Palmitoyl methoxytryptamine

0.50

前插行后插行

QS = quantity sufficient.

An aqueous system with solubilizers

The example combines water and propylene glycol with solubilizing ingredients.

This is a historical formula. The patent does not report toner stability or efficacy in humans.

Poret JL. US20040022822A1, Example 3, original formula table.

Patent Example 4 | Original formula table

The cleanser example contains 1.00% PMT

​

Editable transcription

Ingredient (original wording)

w/w %

Water

QS

Preservatives

0.30

Decyl glucoside

2.40

Disodium lauroamphodiacetate/sodium trideceth sulfate/hexylene glycol/isopropanol

12.00

Fragrance

0.40

Polyquaternium-10

0.06

Polyquaternium-7

3.00

Diazolidinyl urea

0.20

Propylene glycol, primula veris

0.10

Palmitoyl methoxytryptamine

1.00

前插行后插行

QS = quantity sufficient.

A surfactant-based formula

The original formula combines cleansing ingredients with conditioning polymers.

It provides an example for rinse-off formulation development.

Poret JL. US20040022822A1, Example 4, original formula table.

Product quality | Powder ingredient

Quality specifications for the powder

Item

Stated specification

Method

Appearance

Off-white to pale yellow powder

Visual inspection

Odor

Characteristic, mild

Sensory inspection

Assay

≥98.0%

HPLC

Loss on drying

≤1.0%

105 °C, 2 h

Heavy metals (as Pb)

≤10 ppm

Colorimetry

Acid value

≤2.0 mg KOH/g

Titration

前插行后插行

PuriPharm Co. Ltd.: Palmitoyl Methoxytryptamine powder technical documentation.

Product quality | Storage and microbiology

Storage conditions and microbial limits

Microbiological parameter

Stated limit

Total colony count

≤1000 CFU/g

Yeasts and molds

≤100 CFU/g

Escherichia coli, Staphylococcus aureus, Pseudomonas aeruginosa

Not detected per gram

前插行后插行

24 months

Stated shelf life under specified storage conditions

Store tightly sealed in a cool, dry place. Long-term storage temperature: 2–8 °C.

PuriPharm Co. Ltd.: Palmitoyl Methoxytryptamine powder technical documentation.

Formulation development | Testing

Choose measures that match the product concept

Development focus

Suggested assessment

Incorporation and stability

Assay, microscopy, precipitation, and physical stability

Moisturizing performance

Instrumental hydration testing against a matched vehicle

Firm appearance and feel

Defined instrumental measures and blinded ratings

Oily skin feel

Sebum measurements, shine, and sensory assessment

Finished-product tolerability

Tolerability and user experience under intended conditions of use

前插行后插行

Use the same base formula, conditions of use, and assessment schedule for the active and vehicle control groups.

Development recommendations draw on Greff D. WO1998006695A1, Example 3, and PuriPharm formulation documentation.

PuriPharm Co. Ltd.

Developing PMT-100 skin care products together

Defined molecular structure; relevant topical research; powder format suited to formulation development.

Technical inquiries

service@puripharm.com+86-572-2745768www.puriactives.com

Contact PuriPharm for formulation support and to evaluate NanoActive PMT nanoliposomal palmitoyl methoxytryptamine. Inquiries about samples, specifications, and formulation testing are welcome.

PuriPharm technical and supply documentation; Greff D. WO1998006695A1, Examples 1 and 3.

Appendix | Animal study of homologues

Animal research provides context for the series of homologues

Experimental model

Mice received intraperitoneal injections of melatonin homologues followed 30 minutes later by 950 cGy photon irradiation.

Published results

The abstract reported protective effects across the series, with the C6 and C8 amides showing the best survival outcomes.

Scope of evidence

The indexed abstract provides no separate survival values for PMT and no topical skin outcomes. The study provides background for the N-acyl-5-MT series.

Blickenstaff RT et al. J Pharm Sci. 1994;83:216–218. DOI: 10.1002/jps.2600830220. Villano R, Di Marzo V. Front Chem. 2024;12:1436008. DOI: 10.3389/fchem.2024.1436008.

PuriActives® GPI

PuriActives® GPIGlycerophosphoinositol Choline

Scientific and Technical Profile

PuriActives® GPI

Sunflower-derived soothing technology

For skin and scalp comfort

Glycerophosphoinositol Choline

PuriPharm Co. Ltd.

Product overview · Positioning

An active ingredient for soothing care

Glycerophosphoinositol Choline

GLYCEROPHOSPHOINOSITOL CHOLINE

Source: sunflower phospholipids

Process: enzymatic bioconversion

A scientific basis for sensitive-skin formulations and soothing scalp care.

Original labels: phosphatidylinositol; lysophosphatidylinositol; glycerophosphoinositol; arachidonoyl; stearoyl; PLA₂ and LPLA₁ enzyme labels.

Original Figure 1: schematic of glycerophosphoinositol formation through phosphatidylinositol metabolism.

Corda D et al. Biochim Biophys Acta. 2002;1582:52–69. DOI: 10.1016/S1388-1981(02)00137-3.

Product overview · Chemical identity

The choline salt of glycerophosphoinositol

A defined chemical identity supports ingredient identification, literature searches and active-content calculations.

Item Molecular information
INCI GLYCEROPHOSPHOINOSITOL CHOLINE
CAS 425642-32-6
Molecular formula C₁₄H₃₂NO₁₂P
Molecular weight 437.38 g/mol

This information describes the compound itself. Active content and supply form of the commercial ingredient depend on the applicable product specifications.

PubChem. Glycerophosphoinositol choline. CID 91936944. https://pubchem.ncbi.nlm.nih.gov/compound/91936944

Product overview · Source and process

Enzymatic bioconversion of sunflower phospholipids

Produced by enzymatic bioconversion using sunflower-derived phospholipids as the starting material.

Evidence guide

Research supporting skin and scalp comfort

Understand GPI through its mechanisms, then connect cell, animal and human studies to formulation applications.

Research level Molecular mechanisms
Core question How are inflammatory signals regulated?
Main assessments MAPK, IKK / NF-κB, gene expression
Research level Cells and epidermis
Core question Can irritation-related responses be reduced?
Main assessments Degranulation, cytokines, PGE₂, IL-1α
Research level Animal studies
Core question Are responses observed in vivo?
Main assessments TNF-α, Mac-1 and skin studies of related salts
Research level Human studies and applications
Core question Which care settings have been observed?
Main assessments Erythema, lesions, pruritus, scalp comfort

Ingredient form, model and formulation conditions are specified in the relevant sections.

Mechanisms · Endogenous GroPIns research

GPI participates in cellular lipid-signaling regulation

Sequential deacylation of phosphatidylinositol produces glycerophosphoinositol.

Research on the free metabolite GroPIns provides a mechanistic basis for understanding GPI. This product uses its choline salt form.

Original Figure 1, excerpted from a metabolic schematic. GroPIns = glycerophosphoinositol.

Corda D et al. Biochem Soc Trans. 2012;40:101–107. DOI: 10.1042/BST20110679.

Mechanisms · Endogenous GroPIns research

Inflammatory stimulation increases endogenous GroPIns

LPS stimulation increases intracellular GroPIns in human monocytes.

The study supports a role for this endogenous metabolite in cellular responses to inflammatory stimulation.

Figure labels: untreated; LPS; ng/10⁶ cells; μM. The inset data table is transcribed below.

Inset table: GroPIns levels

Unit Untreated LPS
ng/10⁶ cells 1.14 19.6
μM 4.4 76.4

Original Figure 7. Human monocytes from 9 donors; LPS 0.1 μg/mL for 45 minutes; LC–MS/MS measurement.

Vessichelli M et al. J Biol Chem. 2017;292:12828–12841. DOI: 10.1074/jbc.M116.773861. PMID: 28600357.

Mechanisms · Endogenous GroPIns research

Modulation of MAP kinase signaling

Western blots show that GroPIns reduces LPS-induced ERK, JNK and p38 phosphorylation.

These early signaling changes connect external stimulation to downstream regulation of inflammatory genes.

Original labels: time (min); p- denotes phosphorylated protein; vinculin; GroPIns and the separate GroPIns4P comparator.

Original Figure 3A. Human monocytes; GroPIns 300 μM; representative blots and densitometry. GroPIns4P is a separate comparator substance.

Vessichelli M et al. J Biol Chem. 2017;292:12828–12841. DOI: 10.1074/jbc.M116.773861. PMID: 28600357.

Mechanisms · Endogenous GroPIns research

Effects on the IKK / IκB signaling axis

GroPIns reduces phosphorylation of the IKK complex and alters the time course of IκBα degradation.

This provides a molecular basis for reduced NF-κB activation.

Original labels: time (min); p-IKKα/β and p-IκBα phosphorylation readouts; vinculin.

Original Figure 3B. Pretreatment with GroPIns 300 μM for 20 minutes, followed by LPS 0.1 μg/mL; observation at 5–30 minutes.

Vessichelli M et al. J Biol Chem. 2017;292:12828–12841. DOI: 10.1074/jbc.M116.773861. PMID: 28600357.

Mechanisms · Endogenous GroPIns research

Microscopy reveals NF-κB localization

Original micrographs show changes in cellular p50 and p65 localization after inflammatory stimulation.

GroPIns reduces LPS-induced nuclear translocation of NF-κB.

Original Figure 4A. p50: green; p65: gray; DAPI: blue. GroPIns 300 μM. Original scale bars retained.

Vessichelli M et al. J Biol Chem. 2017;292:12828–12841. DOI: 10.1074/jbc.M116.773861. PMID: 28600357.

Mechanisms · Endogenous GroPIns research

Reduced nuclear translocation of NF-κB

The authors report approximately 50% and 45% reductions in p50 and p65 nuclear translocation, respectively, at 30 minutes with GroPIns.

Figure labels: nuclear p50/p65-positive cells (%); T0; time in min.

Original Figure 4B. LPS 0.1 μg/mL, with or without GroPIns 300 μM; 100 randomly selected cells counted per sample.

Vessichelli M et al. J Biol Chem. 2017;292:12828–12841. DOI: 10.1074/jbc.M116.773861. PMID: 28600357.

Mechanisms · Endogenous GroPIns research

Original EMSA images show reduced NF-κB–DNA binding

GroPIns reduces the LPS-induced NF-κB DNA-binding signal. The original electrophoretic images complement the nuclear-translocation microscopy evidence.

Original Figure 5A–B. Left: cell pretreatment at 50 or 300 μM. Right: nuclear-extract competition experiment at 300–1000 μM. These are different experimental conditions.

Vessichelli M et al. J Biol Chem. 2017;292:12828–12841. DOI: 10.1074/jbc.M116.773861. PMID: 28600357.

Mechanisms · Endogenous GroPIns research

Reduced NF-κB recruitment to target-gene promoters

Chromatin immunoprecipitation provides further promoter-level evidence.

Reduced p65 recruitment to the TNF-α promoter is consistent with lower proinflammatory transcription.

Figure labels: normal rabbit IgG; binding relative to input (%); UNTD = untreated.

Original Figure 5D. ChIP; GroPIns 300 μM for 20 minutes before LPS 0.1 μg/mL for 60 minutes. TF is a separate mechanistic endpoint.

Vessichelli M et al. J Biol Chem. 2017;292:12828–12841. DOI: 10.1074/jbc.M116.773861. PMID: 28600357.

Mechanisms · Endogenous GroPIns research

Downregulation of proinflammatory gene expression

GroPIns reduces LPS-induced TNF-α, IL-1β and COX-2 transcription. IL-10 expression was not suppressed in this experiment.

Original Figure 1A–D. Primary human monocytes; GroPIns 300 μM for 20 minutes before LPS 0.1 μg/mL; measurements at 1.5 and 24 hours.

Vessichelli M et al. J Biol Chem. 2017;292:12828–12841. DOI: 10.1074/jbc.M116.773861. PMID: 28600357.

Mechanisms · Endogenous GroPIns research

Reduced cytokine release across multiple donors

Protein-level results complement the transcriptional evidence.

At 24 hours, TNF-α release inhibition in the 3 donors shown ranged from 34.5% to 59.5%.

Figure table: inhibition versus LPS (%)

Donor 1

Time TNF-α IL-1β TxB2
5 h 15 31.6 -4.7
24 h 43.7 60.52 51.9

Donor 2

Time TNF-α IL-1β TxB2
5 h 44.7 41.8 31.6
24 h 59.5 79.1 80

Donor 3

Time TNF-α IL-1β TxB2
5 h 5 20.5 5.4
24 h 34.5 73.2 53.8

The figure heading specifies percentage inhibition versus LPS. Original column headers also show pg/mL for TNF-α and IL-1β, and ng/mL for TxB2; these labels remain in the original image.

Original Figure 1G. Percentage inhibition relative to LPS stimulation; TNF-α, IL-1β and TxB2; GroPIns 300 μM.

Vessichelli M et al. J Biol Chem. 2017;292:12828–12841. DOI: 10.1074/jbc.M116.773861. PMID: 28600357.

Mechanisms · Further biology

A mechanistic extension into barrier biology

Beyond inflammatory signaling, GroPIns has also been studied in barrier biology.

In an endothelial–glial coculture model, transendothelial electrical resistance recovered after addition of GPI 100 μM.

Figure labels: TEER; days of culture; control; GPI 100 μM treatment.

Original Figure 3. Blood–brain barrier coculture model, presented as a mechanistic extension. Skin-specific evidence follows in the epidermal-model and human-study sections.

Cucullo L et al. Brain Res. 2004;997:147–151. DOI: 10.1016/j.brainres.2003.09.079.

Cell and epidermal studies · GPI choline

Microscopy and quantitative results support reduced degranulation

GPI choline treatment reduced granules around the cells. Degranulation rates decreased significantly at both 0.1% and 0.3%.

Image labels: A, blank control; B, positive/stimulated control; C–E, GPI 0.3%, 0.1% and 0.01%, respectively.

Degranulation rate

RBL-2H3 condition Degranulation rate
Stimulated control 81.30%
GPI choline 0.1% 70.10%
GPI choline 0.3% 66.15%

Left: original Figure 3; A, blank; B, stimulated; C–E, GPI 0.3%, 0.1% and 0.01%. Right: quantitative results reported in the text; P < 0.01 for both concentrations.

Wang Y, Zou Y. Detergent & Cosmetics. 2023;46(5):19–23. DOI: 10.3969/j.issn.1006-7264.2023.05.006.

Cell and epidermal studies · GPI choline

Significant reductions in TNF-α and IL-6 release

At the tested concentration of 0.3%, the paper reports TNF-α and IL-6 inhibition rates of 93.38% and 94.73%, respectively.

Original Figure 5A–B. PMA-differentiated THP-1 cells; LPS 1 mg/L for 24 hours; 3 parallel measurements. Concentrations are reported as in the source.

Wang Y, Zou Y. Detergent & Cosmetics. 2023;46(5):19–23. DOI: 10.3969/j.issn.1006-7264.2023.05.006.

Cell and epidermal studies · GPI choline

Effects on both IL-8 and IL-1β

Both endpoints decreased significantly at 0.1%–0.3%. At 0.3%, the reported IL-1β inhibition rate was 88.73%.

Original Figure 5C–D. PMA-differentiated THP-1 cells; LPS 1 mg/L for 24 hours. Original axes and significance marks retained.

Wang Y, Zou Y. Detergent & Cosmetics. 2023;46(5):19–23. DOI: 10.3969/j.issn.1006-7264.2023.05.006.

Cell and epidermal studies · GPI choline

Concentration-related responses across inflammatory markers

Significant inhibition was observed at 0.1%, with greater inhibition of some markers at 0.3%.

The table summarizes reported values to compare concentration responses across mediators.

Reported inhibition GPI sample 0.1% GPI sample 0.3%
TNF-α 92.86% 93.38%
IL-6 88.48% 94.73%
IL-1β 59.85% 88.73%

Compiled from sections 2.1 and 2.3 of the paper. Inhibition is relative to the LPS-stimulated group. Experimental concentrations are not finished-product use recommendations.

Wang Y, Zou Y. Detergent & Cosmetics. 2023;46(5):19–23. DOI: 10.3969/j.issn.1006-7264.2023.05.006.

Cell and epidermal studies · GPI choline

Cell viability at efficacy-test concentrations

Across the 0.01%–0.3% range used in the inflammatory-mediator and degranulation experiments, relative viability remained above 90% in both cell types.

Chinese y-axis label: relative cell viability (%). Original groups, 100 mg/L C40/80 challenge and GPI concentrations are retained.

Chinese y-axis label: relative cell viability (%). Original LPS 1 mg/L challenge and GPI concentrations are retained.

Original Figure 2A–B. Left: RBL-2H3 mast cells. Right: THP-1-derived macrophages. Original axes and treatment groups retained.

Wang Y, Zou Y. Detergent & Cosmetics. 2023;46(5):19–23. DOI: 10.3969/j.issn.1006-7264.2023.05.006.

Cell and epidermal studies · Irritation models

Reduced PGE₂ release after UVB stimulation

Normal human epidermal keratinocytes were pretreated with GPI choline for 24 hours before UVB exposure.

The original figure shows lower PGE₂ release at higher tested concentrations, providing cell-level evidence for after-sun soothing concepts.

Original choline-salt experiment and significance marks retained. Concentration unit: μg/mL; PGE₂ normalized to protein content.

Glycerophosphoinositol Choline / Lysine technical brochure (2012), pp.4–5. Original technical-data figure.

Cell and epidermal studies · Irritation models

Concentration response of UVB-induced PGE₂ release

Normal human epidermal cells received UVB at 25 mJ/cm².

In the choline-salt group, PGE₂ decreased from 6.3 to 2.6, 2.2 and 1.8 pg/μg protein at 250, 500 and 1000 μM, respectively.

Translated Table 1: UVB-induced PGE₂ (pg/μg protein)

GPI choline salt

GPI salt concentration (μM) No UVB UVB-exposed
0 1.6 6.3
250 1.4 2.6*
500 1.4 2.2*
1000 2.1 1.8*

GPI tetrabutylammonium salt

GPI salt concentration (μM) No UVB UVB-exposed
0 1.5 6.5
250 1.5 2.1*
500 1.3 1.9*
1000 1.2 1.9*

GPI lysine salt

GPI salt concentration (μM) No UVB UVB-exposed
0 1.7 6.1
250 1.5 1.9*
500 1.4 1.7*
1000 1.1 1.4**

GPI choline + dl-α-tocopherol (10 μM)

GPI salt concentration (μM) No UVB UVB-exposed
0 1.8 6.9
250 1.1 1.2**
500 1.2 1.1**
1000 1.0 1.1**

GPI choline + retinol (5 μM)

GPI salt concentration (μM) No UVB UVB-exposed
0 1.4 6.5
250 1.4 1.4**
500 1.2 1.3**
1000 1.2 1.1**

GPI choline + ascorbic acid (10 μM)

GPI salt concentration (μM) No UVB UVB-exposed
0 1.7 6.3
250 1.5 1.4**
500 1.2 1.4**
1000 1.2 1.1**

* P<0.05; ** P<0.01, versus UVB-exposed cells without added GPI salt.

Original Table 1, retaining comparisons with other salts and combinations. * P < 0.05; ** P < 0.01, each versus UVB-exposed cells without added GPI.

JP2009269851A. 2009-11-19. Efficacy-study Examples 1–3.

Cell and epidermal studies · Irritation models

PGE₂ responses after capsaicin stimulation

PGE₂ release was measured after capsaicin stimulation of normal human epidermal cells.

At higher choline-salt concentrations, the difference between stimulated and unstimulated groups narrowed.

Translated Table 2: PGE₂ after capsaicin 0.01 nM (pg/μg protein)

GPI choline salt

GPI salt concentration (μg/mL) No capsaicin Capsaicin-treated
0 13.3 15.8*
250 13.6 14.5*
500 14.1 14.0
1000 15.0 15.0

GPI tetrabutylammonium salt

GPI salt concentration (μg/mL) No capsaicin Capsaicin-treated
0 10.9 16.1**
250 11.1 15.5**
500 12.0 13.3*
1000 13.5 13.2

GPI lysine salt

GPI salt concentration (μg/mL) No capsaicin Capsaicin-treated
0 9.9 14.8**
250 10.5 12.2*
500 10.1 11.4
1000 11.9 11.7

GPI choline + dl-α-tocopherol (10 μM)

GPI salt concentration (μg/mL) No capsaicin Capsaicin-treated
0 12.8 17.1**
250 12.4 14.1*
500 11.5 12.8
1000 11.8 12.1

GPI choline + retinol (5 μM)

GPI salt concentration (μg/mL) No capsaicin Capsaicin-treated
0 10.1 16.3**
250 9.9 14.0**
500 10.4 12.2*
1000 10.5 11.4

GPI choline + ascorbic acid (10 μM)

GPI salt concentration (μg/mL) No capsaicin Capsaicin-treated
0 11.0 15.6**
250 10.4 13.1*
500 9.5 11.2*
1000 9.0 10.0

* P<0.05; ** P<0.01, capsaicin-treated versus untreated cells at the same tested concentration. Capsaicin concentration is retained as 0.01 nM from the supplied figure heading, without substitution based on typical experimental conditions.

Original Table 2. GPI-salt concentration: μg/mL. Asterisks compare stimulated and unstimulated cells at the same concentration, not the group without GPI.

JP2009269851A. 2009-11-19. Efficacy-study Examples 1–3.

Cell and epidermal studies · Irritation models

Reduced OAG-induced PGE₂ release

With OAG stimulation at 250 μM, PGE₂ readings in the choline-salt group decreased as the tested concentration increased.

The original table also reports unstimulated and combination groups.

Translated Table 3: PGE₂ after OAG 250 μM (pg/μg protein)

GPI choline salt

GPI salt concentration (μg/mL) No OAG OAG-treated
0 8.7 15.6
250 8.9 13.1
500 9.4 10.7
1000 9.8 10.0

GPI tetrabutylammonium salt

GPI salt concentration (μg/mL) No OAG OAG-treated
0 9.5 16.2**
250 10.1 13.0**
500 10.8 11.4*
1000 11.4 11.3

GPI lysine salt

GPI salt concentration (μg/mL) No OAG OAG-treated
0 10.1 15.0**
250 10.6 14.0**
500 11.3 12.1*
1000 11.7 11.6

GPI choline + dl-α-tocopherol (10 μM)

GPI salt concentration (μg/mL) No OAG OAG-treated
0 9.4 13.9**
250 9.3 11.9**
500 8.7 9.1
1000 8.5 9.2

GPI choline + retinol (5 μM)

GPI salt concentration (μg/mL) No OAG OAG-treated
0 10.5 16.2**
250 9.9 14.0**
500 10.2 11.4*
1000 10.5 11.2

GPI choline + ascorbic acid (10 μM)

GPI salt concentration (μg/mL) No OAG OAG-treated
0 10.6 14.9**
250 9.6 12.9**
500 9.4 10.4
1000 8.6 9.0

* P<0.05; ** P<0.01, OAG-treated versus untreated cells at the same tested concentration.

Original Table 3. OAG: 1-oleoyl-2-acetyl-sn-glycerol. Original values, concentration units and statistical marks retained.

JP2009269851A. 2009-11-19. Efficacy-study Examples 1–3.

Cell and epidermal studies · Irritation models

Reduced IL-1α release after surfactant irritation

Reconstructed human epidermis was challenged with SLS 0.5%, comparing mediator release with and without GPI choline 1%.

The combined-treatment group showed lower IL-1α, supporting development of mild-cleansing and soothing-care concepts.

Original readings at 2 h and 6 h retained. SLS: sodium lauryl sulfate. Experimental concentrations follow the technical source.

Glycerophosphoinositol Choline / Lysine technical brochure (2012), pp.4–5. Original technical-data figure.

Animal studies · GroPIns

GroPIns reduces inflammatory mediators and cell-activation markers in mice

Male C57BL/6J mice, 9 per group; blood collected 2 h after LPS 1 mg/kg.

GroPIns 10 mg/kg per intraperitoneal dose was administered 3 times: 15 min before, at the same time as, and 60 min after stimulation.

Both TNF-α and Mac-1 decreased.

Original Figure 6A–B. Males aged 9–12 weeks; free GroPIns. In vivo endpoints in a systemic inflammation model, not a topical skin study.

Vessichelli M et al. J Biol Chem. 2017;292:12828–12841. DOI: 10.1074/jbc.M116.773861. PMID: 28600357.

Animal studies · GPI lysine combinations

Animal skin research with a related salt: ear photographs

21 dogs with atopic-dermatitis-associated otitis externa received a combination lotion twice daily for 14 days.

The formulation contained GPI lysine salt, a lactoferrin peptide and verbascoside.

A: day 0; B: day 14.

Original Figure 5. A: day 0; B: day 14. The study used a GPI lysine-salt combination lotion, distinct from this product’s choline salt.

Accomasso L et al. Clin Dermatol Res J. 2017;2(1):1000112. Figs. 1–5.

Animal studies · GPI lysine combinations

Changes in canine skin-lesion scores and score distribution

In the same 21-dog study, CADESI scores decreased after 14 days and the distribution shifted toward lower scores.

Figure labels: score; score frequency; day 0 and day 14.

Original Figure 1. Red: day 0; black: day 14. Mean ± SD; **** P < 0.0001. GPI lysine-salt combination lotion.

Accomasso L et al. Clin Dermatol Res J. 2017;2(1):1000112. Figs. 1–5.

Animal studies · GPI lysine combinations

Lichenification, excoriation, alopecia and pruritus scores

The same study assessed lichenification, excoriation, alopecia and pruritus.

All four scores decreased after 14 days, complementing the ear photographs and overall lesion scores.

Figure labels: lichenification; excoriation; alopecia; pruritus; degree.

Original Figure 2A–D. Day 0 versus day 14; mean ± SD; **** P < 0.0001. Alopecia scores cannot be extrapolated to human hair-growth efficacy.

Accomasso L et al. Clin Dermatol Res J. 2017;2(1):1000112. Figs. 1–5.

Animal studies · GPI lysine combinations

Shed corneocyte, bacterial and Malassezia scores

Ear cytology in the same study assessed changes in shed corneocytes, bacteria and Malassezia.

Figure labels: corneocytes; bacteria; Malassezia; degree.

Original Figure 3A–C. 21 dogs, 14 days; mean ± SD; **** P < 0.0001. The combination’s effects cannot be attributed to antimicrobial activity of GPI alone.

Accomasso L et al. Clin Dermatol Res J. 2017;2(1):1000112. Figs. 1–5.

Human skin studies · UVB erythema

Approximately 60% erythema inhibition with a GPI choline formulation

20 participants received 2 MED UVB on the forearm.

A GPI choline 0.25% formulation was applied for 6 hours, with erythema monitored by reflectance spectrophotometry over 48 hours.

The technical brochure reports approximately 60% erythema inhibition.

Figure labels: erythema inhibition (%); commercial lenitive cream; GPI 0.25% formulation; 0.1% cortisonic formulation. Original P values and comparison groups retained.

Original comparison of three formulations and statistical marks retained. Results apply to the tested topical formulation. MED: minimal erythema dose.

Glycerophosphoinositol Choline / Lysine technical brochure (2012), p.5. Human UVB erythema study.

Human skin studies · UVB erythema

Erythema observations with GPI choline 0.5% and 1.0% formulations

Adult male backs received UV exposure at 1.5 MED.

Original grayscale photographs at 6, 24 and 48 hours show local skin appearance with placebo and two GPI formulations.

Figure labels: placebo; 6, 24 and 48 h; 0.5% GPI and 1.0% GPI formulations.

Original Figure 1. Patent grayscale and image quality retained. The patent does not clearly report sample size; the photographs illustrate the local observations shown.

JP2009269851A. 2009-11-19. Efficacy-study Examples 1–3.

Human skin studies · UVB erythema

Time course of erythema colorimetry and local blood flow

The same study used Δa* and local blood-flow measurements to complement visual observations.

The original table marks significant differences versus placebo at specific concentrations and times.

Translated Table 4: in vivo UVB-induced erythema assessment

Δa* values

Time Placebo GPI 0.5 wt% GPI 1.0 wt%
6 h 2.50 1.38 1.38*
24 h 4.19 3.16 2.68
48 h 3.21 2.62 2.26

Blood flow: MASS(volume)

Time Placebo GPI 0.5 wt% GPI 1.0 wt%
6 h 324.4 331.2* 304.4
24 h 291.7 163.6** 200.6**
48 h 174.1 157.5 171.5

Blood flow: MASS(volume). Patent definitions: * P<0.01; ** P<0.05 versus placebo. Original values and marks are retained without recalculation or correction.

Original Table 4. Patent definitions: * P < 0.01; ** P < 0.05. Blood-flow units retained as MASS(volume).

JP2009269851A. 2009-11-19. Efficacy-study Examples 1–3.

Human skin studies · 30-participant AD observation

A 30-participant, 4-week observation: improved lesions and pruritus

30 participants aged 4–16 years with mild-to-moderate atopic dermatitis used a formulation containing GPI choline and Perilla extract twice daily.

Mean EASI: 5.01 to 1.35

Pruritus VAS: 4.05 to 1.67

Figure legend: healing; marked improvement; improvement; no change.

Original Figure 1. Open-label, multicenter observation: 13 rated healed, 8 markedly improved, 8 improved and 1 unchanged. Five participants used rescue medication for one week.

Di Lernia V et al. G Ital Dermatol Venereol. 2011;146(Suppl. 2 to No. 6):1–5.

Human skin studies · 30-participant AD observation

Lesion appearance in two participants after 4 weeks

Left: patient 9, EASI 12.4 to 7.6. Right: patient 7, EASI 6.2 to 2.7. Within each pair, A is baseline and B is after 4 weeks.

Original Figures 2–3; lesions and colors unretouched. Table I records rescue-medication use in both cases. Results apply to the study formulation and treatment conditions.

Di Lernia V et al. G Ital Dermatol Venereol. 2011;146(Suppl. 2 to No. 6):1–5.

Human skin studies · 300-participant AD observation

A 300-participant observation: pruritus improvement in adults and children

An observational study enrolled 300 patients with moderate atopic dermatitis.

A GPI choline-containing emollient ointment reduced total pruritus scores:

Adults: 7.90 to 4.46

Children: 9.10 to 5.86

Figure labels: adults; children; V1/V2 = first visit/follow-up.

Original Figure 1e. Mean ± SEM; follow-up 33.69 ± 8.49 days; GPI group: 95 adults and 51 children; p < 0.001. The study evaluated a combination emollient ointment.

Marko M, Pawliczak R. J Dermatolog Treat. 2022;33(2):999–1010. DOI: 10.1080/09546634.2020.1800567. PMID: 32746664.

Human skin studies · 300-participant AD observation

Improved pruritus and sleep-related burden

The same study reported improvements in pruritus distribution, sleep disturbance, episode frequency and severity.

Original Figure 1a–d: distribution, sleep disturbance, frequency and severity, respectively. V1/V2: first visit/follow-up; mean ± SEM. The formulation contained other functional ingredients.

Marko M, Pawliczak R. J Dermatolog Treat. 2022;33(2):999–1010. DOI: 10.1080/09546634.2020.1800567. PMID: 32746664.

Human skin studies · 300-participant AD observation

Improved clinical scores with the GPI-containing emollient

Adult EASI decreased from 25.18 to 11.96 and pruritus VAS from 5.82 to 3.40, informing development of soothing GPI emollient systems.

Original Figure 2: EASI, TIS and VAS. Open-label observational study in atopic dermatitis. Results apply to the complete formulation and cannot be attributed to GPI alone.

Marko M, Pawliczak R. J Dermatolog Treat. 2022;33(2):999–1010. DOI: 10.1080/09546634.2020.1800567. PMID: 32746664.

Human skin studies · 300-participant AD observation

Greater EASI, TIS and VAS improvements in the GPI-formulation group

The original figure compares score changes between visits, separately for adults and children.

The GPI emollient group improved more than the comparator emollient group on all three measures.

Figure labels: GPI emollient ointment; comparator emollient; adults and children. Negative changes indicate improvement from baseline.

Original Figure 8. A: EASI; B: TIS; C: VAS. Mean ± SEM; *** P < 0.001. Unblinded observational comparison of complete formulations.

Marko M, Pawliczak R. J Dermatolog Treat. 2022;33(2):999–1010. DOI: 10.1080/09546634.2020.1800567. PMID: 32746664.

Human skin studies · 300-participant AD observation

Between-group comparisons of total pruritus and sleep disturbance

The GPI-formulation group showed larger reductions in total pruritus scores and sleep disturbance.

Figure labels: GPI emollient ointment; comparator emollient; adults; children.

Figure labels: GPI emollient ointment; comparator emollient; adults; children.

Original Figures 7e and 7b. Left: total pruritus score; right: sleep disturbance. Negative values indicate improvement from baseline. Original statistical marks retained.

Marko M, Pawliczak R. J Dermatolog Treat. 2022;33(2):999–1010. DOI: 10.1080/09546634.2020.1800567. PMID: 32746664.

Human skin studies · 300-participant AD observation

Subjective ratings of use experience and symptom improvement

The study also recorded texture, spreading, absorption, product performance and symptom-relief ratings.

Differences between formulations in some items may inform formulation experience design.

Original Figure 9. Left: adults; right: children. Not all items differed significantly between groups; consult the original marks.

Marko M, Pawliczak R. J Dermatolog Treat. 2022;33(2):999–1010. DOI: 10.1080/09546634.2020.1800567. PMID: 32746664.

Human skin studies · Other conditions

A 60-day observation of lesions, redness, pruritus and TEWL

30 participants with mild-to-moderate psoriasis used a GPI choline 1% cream twice daily for 60 days.

Figure labels: psoriatic lesion regression; redness variation; reduction of itchiness; transepidermal water loss; days.

Original panels: lesion-improvement grade, redness, pruritus and transepidermal water loss (TEWL). Formulation observations in a specific skin condition.

Falconi Klein E, Carrera C, Richelmi P. University of Pavia, May 2003, report 0201L07-05F. Cited via the technical brochure (2012), p.5.

Human skin studies · Other conditions

A GPI combination gel improves facial scaling, erythema and pruritus

25 participants with mild-to-moderate facial seborrheic dermatitis; open-label prospective study, twice-daily use for 45 days.

Assessment Reported result
Scaling, erythema and pruritus All decreased significantly, P < 0.001
Investigator global assessment 47.9% achieved >80% improvement
Assessment methods Clinical scores, erythema-directed photography and pruritus VAS
Formulation GPI, piroctone olamine, lactoferrin and aloe vera

Results apply to the complete combination gel. The abstract identifies GPI without specifying its salt form. This does not quantify the efficacy of choline salt alone.

Dall’Oglio F et al. G Ital Dermatol Venereol. 2017;152(5):436–440. DOI: 10.23736/S0392-0488.17.05539-0. PMID: 28121079.

Human scalp study · 30-day observation

Scalp appearance after 30 days

10 participants with dandruff and seborrheic dermatitis used a GPI choline 0.25% lotion once daily.

Participant 1

Before use

After 30 days

Participant 2

Before use

After 30 days

Two participants from the same study. Original paired scalp-dermoscopy images are shown before and after use. Observations apply to the tested lotion.

Pazzaglia M, Tosti A. Scalp dermatoscopy study report. University of Bologna, January 2007. Original images cited via the supplied technical brochure (2012), p.6.

Human scalp study · 30-day observation

Distribution of improvement in dandruff, redness and pruritus

The same 30-day study also assessed dandruff, redness, pruritus and sebum.

The original figure shows participant proportions in each improvement category, complementing the dermoscopy observations.

Figure labels: dandruff; redness; itchiness; sebum amount; patients (%). Legend: worsening, no change, slight improvement, significant improvement, very significant improvement.

Original assessment figure. n = 10; GPI choline 0.25% lotion, once daily for 30 days. Original grading and participant proportions retained.

Pazzaglia M, Tosti A. Scalp dermatoscopy study report. University of Bologna, January 2007. Original figure cited via the supplied technical brochure (2012), p.6.

Applications · Formulation directions

Formulation applications for skin and scalp care

Calculate active addition from the selected ingredient’s specifications.

Validate stability, compatibility and sensory properties in the target formulation.

Format Facial serum
Product concept Daily soothing for sensitive skin
Development focus Low stinging and comfortable skin feel
Format Face / body cream
Product concept Soothing emollient care
Development focus Balance of hydration and emollience
Format After-sun lotion
Product concept Comfort after sun exposure
Development focus Tolerance on irritated skin
Format Scalp serum
Product concept Lightweight leave-on care
Development focus Scalp contact and low residue
Format Mild shampoo
Product concept Cleansing and scalp comfort
Development focus Mild surfactant system and scalp tolerance

These are formulation-development concepts. Use level, pH and processing conditions should follow the applicable PuriPharm product technical specifications.

Applications · Product value

PuriActives® GPI Glycerophosphoinositol Choline

Sunflower-derived, produced by enzymatic bioconversion

Cellular mechanisms, animal research and human formulation observations support development of soothing skin and scalp care.

PuriPharm Co. Ltd.

References

References: molecular mechanisms and cell studies

Wang Y, Zou Y. Detergent & Cosmetics. 2023;46(5):19–23. DOI: 10.3969/j.issn.1006-7264.2023.05.006.

Vessichelli M et al. J Biol Chem. 2017;292:12828–12841. DOI: 10.1074/jbc.M116.773861. PMID: 28600357.

Corda D et al. Biochim Biophys Acta. 2002;1582:52–69. DOI: 10.1016/S1388-1981(02)00137-3.

Corda D et al. Biochem Soc Trans. 2012;40:101–107. DOI: 10.1042/BST20110679.

Cucullo L et al. Brain Res. 2004;997:147–151. DOI: 10.1016/j.brainres.2003.09.079.

References

References: human skin and scalp studies

Marko M, Pawliczak R. J Dermatolog Treat. 2022;33(2):999–1010. DOI: 10.1080/09546634.2020.1800567. PMID: 32746664.

Di Lernia V et al. G Ital Dermatol Venereol. 2011;146(Suppl. 2 to No. 6):1–5.

Dall’Oglio F et al. G Ital Dermatol Venereol. 2017;152(5):436–440. DOI: 10.23736/S0392-0488.17.05539-0. PMID: 28121079.

Glycerophosphoinositol Choline / Lysine technical brochure (2012), pp.4–6.

Pazzaglia M, Tosti A. University of Bologna, January 2007.

Falconi Klein E et al. University of Pavia, May 2003. Report 0201L07-05F.

References

References: efficacy patent and related-salt studies

JP2009269851A. 2009-11-19.

Efficacy-study Examples 1–3; original Tables 1–4 and Figure 1.

Accomasso L et al. Clin Dermatol Res J. 2017;2(1):1000112. Figs. 1–5.

Animal study of a GPI lysine-salt combination lotion.

PubChem. Glycerophosphoinositol choline. CID 91936944. https://pubchem.ncbi.nlm.nih.gov/compound/91936944